

Question: background data set ?https://drive.google.com/open?id=1zquO9MsC-5YCHU0eDw8ohoEZIIRHxE8l background data form?https://drive.google.com/open?id=1xo7-5lB8hRwez-vGXKNyjYUqEPM4EhLf Directions. Type up your answers to the following problem in a Word file named homework09_yourPSUloginid. Copy, paste and
background data set ?https://drive.google.com/open?id=1zquO9MsC-5YCHU0eDw8ohoEZIIRHxE8l
background data form?https://drive.google.com/open?id=1xo7-5lB8hRwez-vGXKNyjYUqEPM4EhLf
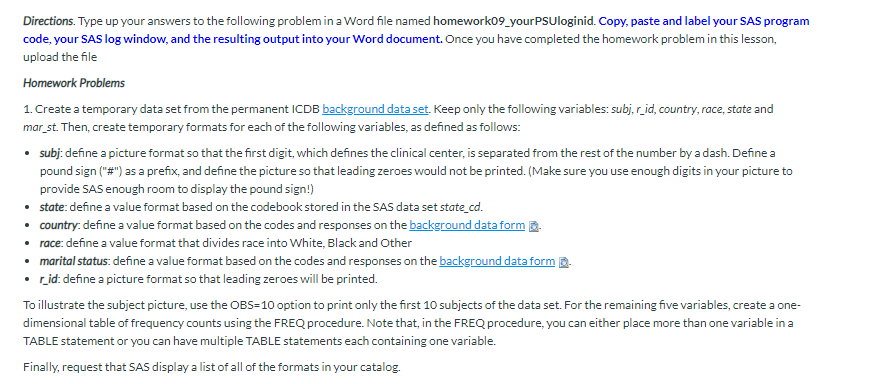
Directions. Type up your answers to the following problem in a Word file named homework09_yourPSUloginid. Copy, paste and label your SAS program code, your SAS log window, and the resulting output into your Word document. Once you have completed the homework problem in this lesson, upload the file Homework Problems 1. Create a temporary data set from the permanent ICDB background data set. Keep only the following variables: subj, rid, country, race, state and mar_st. Then, create temporary formats for each of the following variables, as defined as follows: . subj: define a picture format so that the first digit, which defines the clinical center, is separated from the rest of the number by a dash. Define a pound sign ("#") as a prefix, and define the picture so that leading zeroes would not be printed. (Make sure you use enough digits in your picture to provide SAS enough room to display the pound sign!) state: define a value format based on the codebook stored in the SAS data set state_cd. country: define a value format based on the codes and responses on the background data form . "race: define a value format that divides race into White, Black and Other . marital status: define a value format based on the codes and responses on the background data form . . _id: define a picture format so that leading zeroes will be printed. To illustrate the subject picture, use the OBS=10 option to print only the first 10 subjects of the data set. For the remaining five variables, create a one- dimensional table of frequency counts using the FREQ procedure. Note that, in the FREQ procedure, you can either place more than one variable in a TABLE statement or you can have multiple TABLE statements each containing one variable. Finally, request that SAS display a list of all of the formats in your catalog
Step by Step Solution
There are 3 Steps involved in it

Get step-by-step solutions from verified subject matter experts