

Question: Background: In this project we continue to study earthquake activity. We will use a file with data once again obtained from the United States Geological
Background: In this project we continue to study earthquake activity. We will use a file with data once again obtained from the United States Geological Survey website, about earthquakes of magnitude 5 or greater that have occurred across the planet over the past year (since November 1, 2017). In this project we continue to study earthquake activity. We will use a file with data once again obtained from the United States Geological Survey website, about earthquakes of magnitude 5 or greater that have occurred across the planet over the past year (since November 1, 2017). Requirements: Functions to read and process earthquake data saved in a file are adapted from Ch. 7 of the text. Function readFile is based on the function in ch. 7 of the text (p. 255). You will need to revise it to accommodate the earthquake data file analyzed in this project: the earthquake file we are using has a header line, each line has a return ( ) character, the values are comma (not space) separated, and the longitude and latitude are in different fields (columns) than the data in the text. (readFile will be very similar to equake_readf from Project 7-2, except that it will return a dictionary rather than a list.) Functions euclidD, createCentroids, and createClusters are all copied from Ch. 7 of the text. You will need to add docstrings and helpful in-line comments. Note that the createClusters function includes code to report the results of the cluster analysis (for c in clusters ). This is helpful for testing createClusters with a small data dictionary (data file), but you may comment this out for the large earthquake file. visualizeQuakes is based on the function in Ch. 7 of the text. visualizeQuakes in this project has k (the number of clusters) and r (the number of times to repeat cluster analysis) as parameters, along with the dataFile parameter. As in the text, visualizeQuakes should call readFile, createCentroids, and createClusters. visualizeQuakes will also call a new function, eqDraw, to plot the earthquake data on a world map. visualizeQuakes should return None. You will need to write a docstring and add comments to visualizeQuakes. eqDraw is a new function that will be called by visualizeQuakes to do the work of plotting the results of the k-means analysis on a world map. eqDraw will have three parameters: k, eqDict, the earthquake data dictionary, and eqClusters, the list of clusters generated for the earthquake data by the k-means cluster analysis eqDraw will comprise the drawing code that is included in visualizeQuakes in the text. You should change the screensize method arguments to 1800 and 900, to reflect the size of the world map .gif that we will use. You can also use the anonymous turtle from the turtle module (i.e., you do not need to define quakeT). Tip: include speed('fastest')*. Finally, define a main function to assign values to k, r, and f, and call visualizeQuakes. main should return None. Include code in your .py file to call the main function.
given code:
def euclidD(point1, point2):
"""
"""
total = 0 for index in range(len(point1)):
diff = (point1[index] - point2[index]) ** 2
total = total + diff
euclidDistance = math.sqrt(total)
return euclidDistance
def createCentroids(k, datadict):
"""
"""
centroids = []
centroidCount = 0
centroidKeys = []
while centroidCount
rkey = random.randint(1,len(datadict))
if rkey not in centroidKeys:
centroids.append(datadict[rkey])
centroidKeys,append(rkey)
centroidCount = centroidCount + 1
return centroids
def createClusters(k, centroids, datadict, repeats):
"""
"""
for apass in range(repeats):
print("****Pass",apass,"****")
clusters = []
for akey in datadict:
distance = []
for clusterIndex in range(k):
dist = euclidD(datadict[akey],centroids[clusterIndex])
distance.append(dist)
mindist = main(distances)
index = distance.index(mindist)
clusters[index].append(akey)
dimensions = len(datadict[1])
for clusterIndex in range(k):
sums = [0] * dimensions
for akey in clusters[clusterIndex]:
datapoints = datadict[akey]
for ind in range(len(datapoints)):
sums[ind] = sums[ind] + datapoints[ind]
for ind in range(len(sums)):
clusterLen = len(cluster[clusterIndex])
if clusterLen != 0:
sums[ind] = sums[ind] / clusterLen
centroids[clusterIndex] = sums
for c in clusters:
print("CLUSTER")
for key in c:
print(datadict[key], end =" ") print() return clusters def readFile(filename):
def readFile(filename): ''' (str)->(float, float) takes the input file and finds the longitudes and latitudes''' datafile = open(filename, 'r') datadict = {} key = 0 datafile.readlines()[1:] with open(filename) as f: f.readline() for l in f: items = l.split(',') key = key + 1 lat = float(items[1]) lon = float(items[2]) datadict[key] = [lon, lat] return datadict
visulizeQuakes(dataFile):
datadict = readFile(dataFile)
quakeCentroids = createCentroids(6,datadict)
clusters = createClusters(6, quakeCentroids, datadict, 7)
quakeT = turtle.Turtle()
quakeWin = turtle,screen()
quakeWin,bgpic("worldmap.gif")
quakeWin.screensize(448,266)
wFactor = (quakeWin,screensize()[0]/2)/180
hFctor = (quakeWin.screensize()[1]/2)/90
quakeT.hideturtle()
quakeT.up()
colorlist = ["red","green","blue","orange","cyan","yellow"]
for clusterIndex in range(6):
quakeT.color(colorlist[clusterIndex])
for akey in clusters[clusterIndex]:
lon = datadict[akey][0]
lat = datadict[akey][1]
quakeT.goto(lon*wFactor,lat*hFactor)
quakeT.dot()
quakeWin.exitonclick()
given map: 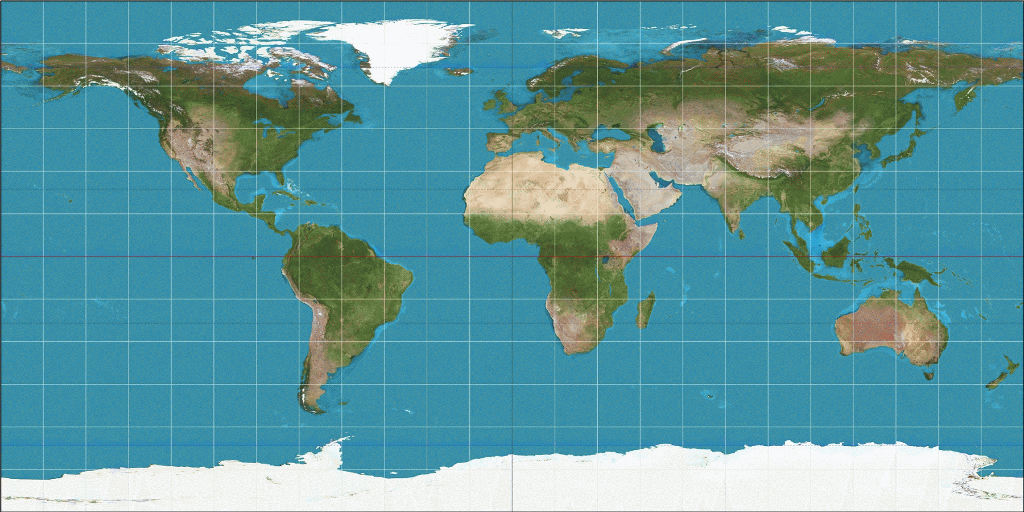
given file: "earthquakes.txt" time,latitude,longitude,depth,mag,magType,nst,gap,dmin,rms,net,id,updated,place,type,horizontalError,depthError,magError,magNst,status,locationSource,magSource 2018-02-27T20:11:04.000Z,-6.2147,142.8358,10,5.2,mb,,24,5.328,0.8,us,us2000d8u9,2018-02-27T20:53:09.719Z,"90km W of Mendi, Papua New Guinea",earthquake,4.2,1.7,0.051,130,reviewed,us,us 2018-02-27T17:29:23.350Z,-60.1778,150.7321,10,5.9,mwb,,43,7.222,1.4,us,us2000d8rl,2018-02-27T19:31:51.991Z,"West of Macquarie Island",earthquake,8.2,1.8,0.053,34,reviewed,us,us 2018-02-27T16:19:53.880Z,-6.0855,142.8469,10,5.2,mb,,33,5.397,0.85,us,us2000d8r4,2018-02-27T17:50:36.040Z,"78km SSW of Porgera, Papua New Guinea",earthquake,8.4,1.8,0.045,162,reviewed,us,us 2018-02-27T14:11:18.610Z,-6.3589,142.9858,14.45,5,mb,,56,5.123,0.74,us,us2000d8q9,2018-02-27T17:54:04.040Z,"76km WSW of Mendi, Papua New Guinea",earthquake,9.2,4.4,0.082,47,reviewed,us,us 2018-02-27T13:58:27.080Z,-6.3793,143.203,14.7,5,mww,,28,4.939,0.67,us,us2000d8q3,2018-02-27T16:07:21.727Z,"54km WSW of Mendi, Papua New Guinea",earthquake,5.7,3.7,0.075,17,reviewed,us,us 2018-02-27T07:19:23.350Z,-6.3225,142.7909,10,5.2,mb,,51,5.301,0.89,us,us2000d8nf,2018-02-27T07:37:19.040Z,"96km W of Mendi, Papua New Guinea",earthquake,7.3,1.6,0.06,93,reviewed,us,us 2018-02-27T06:19:12.240Z,-6.4178,143.0483,10,5.6,mww,,34,5.038,1.29,us,us2000d8my,2018-02-27T17:25:19.040Z,"71km WSW of Mendi, Papua New Guinea",earthquake,7.6,1.9,0.061,26,reviewed,us,us 2018-02-27T05:17:58.320Z,-18.8524,169.2939,196.49,5.5,mww,,102,2.721,0.91,us,us2000d8mh,2018-02-27T21:05:42.040Z,"77km N of Isangel, Vanuatu",earthquake,8.4,4.5,0.073,18,reviewed,us,us 2018-02-27T02:15:07.930Z,-6.5309,143.2716,10,5.2,mb,,84,4.793,1.02,us,us2000d8k4,2018-02-27T05:36:51.666Z,"57km SW of Mendi, Papua New Guinea",earthquake,8.6,1.9,0.095,36,reviewed,us,us 2018-02-27T00:55:22.590Z,-6.0456,142.6355,10,5,mb,,29,5.588,1,us,us2000d8jk,2018-02-27T08:58:00.339Z,"89km SW of Porgera, Papua New Guinea",earthquake,7.6,1.9,0.064,77,reviewed,us,u
Step by Step Solution
There are 3 Steps involved in it

Get step-by-step solutions from verified subject matter experts