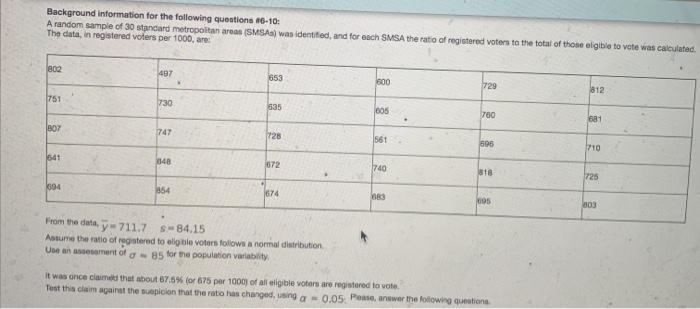
Question: Background information for the following questions 16-10: A random sample of 30 standard metropolitan areas (SMS) was identified, and for each SNSA the ratio of

Background information for the following
Background information for the following questions 16-10: A random sample of 30 standard metropolitan areas (SMS) was identified, and for each SNSA the ratio of registered voters to the total of those eligible to vote was calculated The data in registered voters per 1000, are: 802 497 653 600 729 812 751 730 635 605 760 681 807 747 728 561 596 710 641 348 672 740 725 694 854 674 BB 095 303 From the day - 711.7 S-84.15 Asume the ratio of registered to alig ble voters follows a normal distribution Uansement of 85 for the population variability it was once claimed that about 87.5% for 675 per 1000 of all eligible voters are registered to vote. Tost this claim against the topicion that the ratio has changed, using a = 0.05. Pose, wwer the following ustions O izl s -1.00 Q8. rejection rule: Reject Ho if 2.98 O zl 2 1.96 O IZ $ 1.05 O zl

Step by Step Solution

There are 3 Steps involved in it

1 Expert Approved Answer
Step: 1 Unlock blur-text-image
Question Has Been Solved by an Expert!

Get step-by-step solutions from verified subject matter experts

Step: 2 Unlock
Step: 3 Unlock

Students Have Also Explored These Related General Management Questions!