

Question: Background information: Notation: In this homework, we use the following notations: . In denotes the left Riemann sum using n rectangles . R. denotes the

Background information:

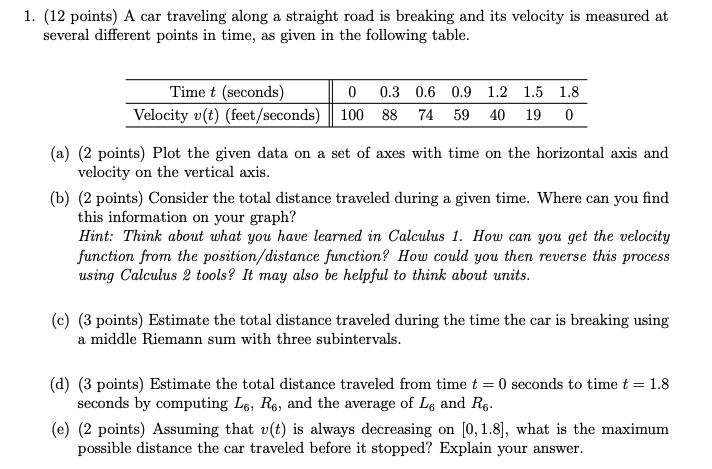
Notation: In this homework, we use the following notations: . In denotes the left Riemann sum using n rectangles . R. denotes the right Riemann sum using n rectangles . M. denotes the midpoint Riemann sum using n rectangles1. (12 points) A car traveling along a straight road is breaking and its velocity is measured at several different points in time, as given in the following table. Time t (seconds) 0 0.3 0.6 0.9 1.2 1.5 1.8 Velocity v(t) (feet/seconds) 100 88 74 59 40 19 0 (a) (2 points) Plot the given data on a set of axes with time on the horizontal axis and velocity on the vertical axis. (b) (2 points) Consider the total distance traveled during a given time. Where can you find this information on your graph? Hint: Think about what you have learned in Calculus 1. How can you get the velocity function from the position/distance function? How could you then reverse this process using Calculus 2 tools? It may also be helpful to think about units. (c) (3 points) Estimate the total distance traveled during the time the car is breaking using a middle Riemann sum with three subintervals. (d) (3 points) Estimate the total distance traveled from time t = 0 seconds to time t = 1.8 seconds by computing Le, Re, and the average of Le and Re. (e) (2 points) Assuming that v(t) is always decreasing on [0, 1.8], what is the maximum possible distance the car traveled before it stopped? Explain your
Step by Step Solution
There are 3 Steps involved in it

Get step-by-step solutions from verified subject matter experts