

Question: Background: Part A: Acquiring Data 1. Go to https://www.transtats.bts.gov. Under Flight Delays, click on more. This will lead to a new page that displays On-Time
Background:
Part A: Acquiring Data
1. Go to https://www.transtats.bts.gov. Under "Flight Delays," click on "more." This will lead to a new page that displays "On-Time Performance and Flight Delays.
2. Under "Filter Airport," select "New York, NY: John F. Kennedy International."
3. Under "Filter Carrier," select "Delta."
4. Under "Filter Operation," select "Departures."
5. Click on "Recalculate" and record the Percent Delayed data into your statistical program.
6. Repeat Steps 3 and 5 for "JetBlue."
7. Record the descriptive statistics information for the two sets of data using your statistical program.
Stats from D
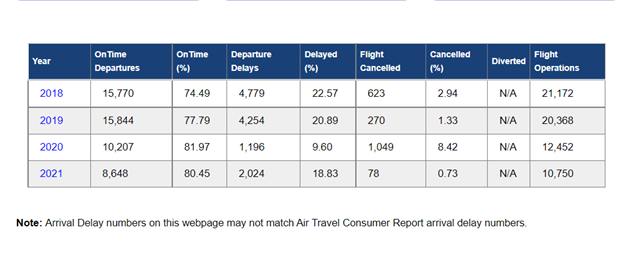
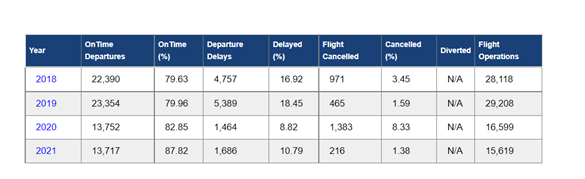
On Time On Time Year Departure Delayed Flight Cancelled Flight Departures (%) Delays Diverted Cancelled Operations 2018 15,770 74.49 4,779 22.57 623 2.94 NA 21,172 2019 15.844 77.79 4.254 20.89 270 1.33 NA 20.368 2020 10,207 81.97 1,196 9.60 1,049 8.42 N'A 12,452 2021 8.648 80.45 2.024 18.83 78 0.73 N'A 10.750 Note: Arrival Delay numbers on this webpage may not match Air Travel Consumer Report arrival delay numbers.On Time On Time Departure Delayed Flight Cancelled Flight Year Diverted Departures Delays Cancelled (x) Operations 2018 22,390 79.63 4,757 16.92 971 3.45 NA 28 118 2019 23,354 79.06 5,389 18.45 465 1.59 NA 29 208 2020 13,752 82.85 1,464 8 82 1,383 8,33 NA 16.599 2021 13,717 87.82 1.686 10.79 216 1.38 NA 15 619
Step by Step Solution
There are 3 Steps involved in it

Get step-by-step solutions from verified subject matter experts