

Question: bail Tony Question 2 Write a MATLAB script to obtain the following MATLAB figure where the values of the independent variable 1 ranges from 4
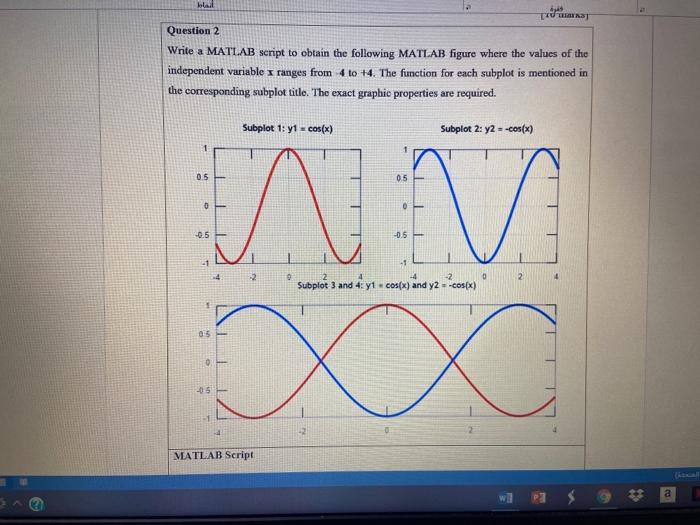
bail Tony Question 2 Write a MATLAB script to obtain the following MATLAB figure where the values of the independent variable 1 ranges from 4 to +4. The function for each subplot is mentioned in the corresponding subplot title. The exact graphic properties are required. Subplot 1: y1 = cos(x) Subplot 2: y2 --COS(X) 1 0.5 0.5 O -0.5 -0.5 2 0 2 v w -4 -2 Subplot 3 and 4: y1.cos(x) and y2 --COS(X) 05 0. -2 MATLAB Script
Step by Step Solution
There are 3 Steps involved in it
1 Expert Approved Answer
Step: 1 Unlock

Question Has Been Solved by an Expert!
Get step-by-step solutions from verified subject matter experts
Step: 2 Unlock
Step: 3 Unlock