

Question: Balance Sheet Analysis 1 2 3 4 5 6 7 S 9 10 11 12 13 14 15 16 17 18 19 20 21 22
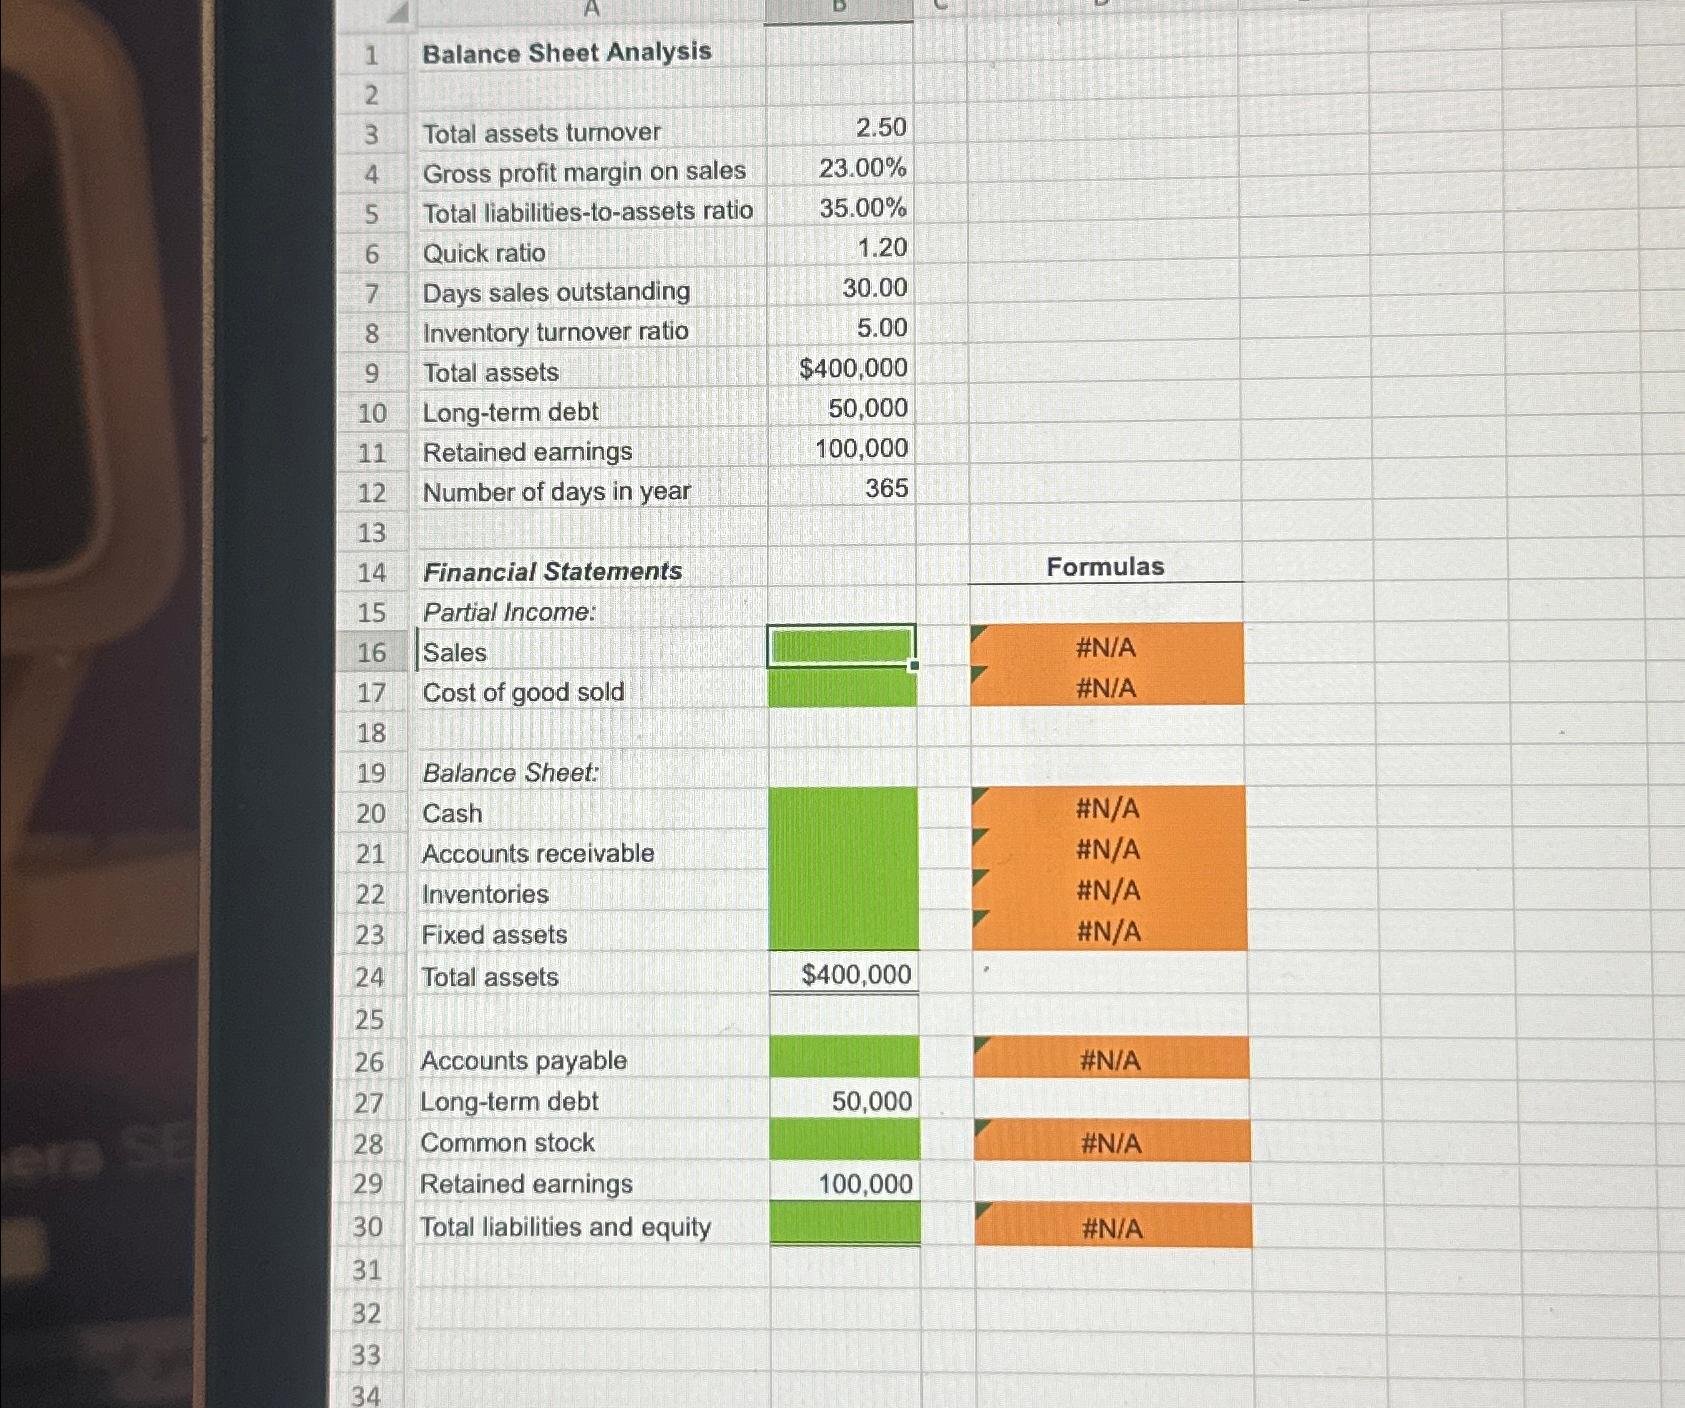
1 2 3 4 5 6 7 S 9 10 11 12 13 14 15 16 17 18 19 20 21 22 23 24 25 26 27 28 29 30 31 32 33 Balance Sheet Analysis Total assets tumover Gross profit margin on sales Total liabilities-to-assets ratio Quick ratio Days sales outstanding Inventory turnover ratio Total assets 2.50 23.00% 35.00% 1.20 30.00 5.00 $400,000 50,000 Long-term debt Retained earnings Number of days ioypar Financial Statements Partial Income: Sales Cost Of good sold Balnce Sheet: Cash Accounts receivable Inventories Fixed assets Total assets Accounts payable Long-term debt Common stock Retained earnings Total liabilities and equity 100,000 365 $400,000 50,000 100,000 Formulas N/A #N/A N/ N/
Step by Step Solution
There are 3 Steps involved in it

Get step-by-step solutions from verified subject matter experts