

Question: Balance Sheet Analysis. In this section, use financial statements and accompanying notes to: A. Analyze what the company's current and prior year liquidity and debt-to-equity
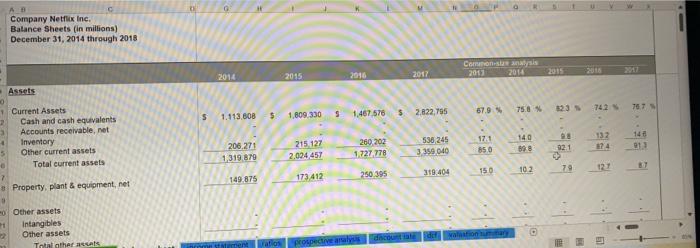
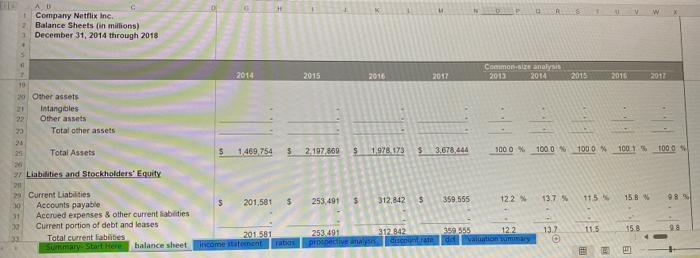
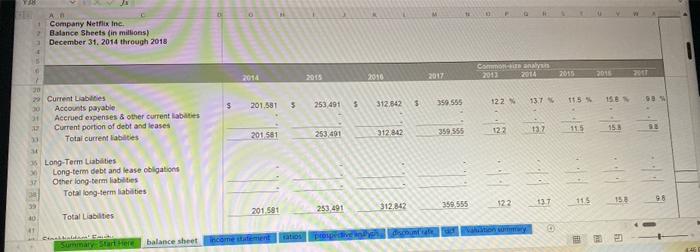

B Company Netflix Inc. Balance Sheets (in millions) December 31, 2014 through 2018 Assets 10 1 Current Assets 2 Cash and cash equivalents 3 Accounts receivable, net 4 Inventory 5 Other current assets 6 Total current assets 7 Property, plant & equipment, net 0 o Other assets Intangibles Other assets Total other assets M 122 2014 S 1.113.608 206,271 1,319,879 149.875 $ ratios 2015 2016 1,809,330 S 1,467,576 $ 215,127 260,202 2.024 457 1,727 778 173,412 250 395 prospective analysis discount ate op Commons analysis 2014 2013 2017 2.822,795 67.9 % 75.8 % 536,245 17.1 14.0 3,359 040 85.0 89.8 319.404 15.0 dif valuation summary 10.2 2015 82.3 % 9.8 92.1 79 74.2 % 132 874 127 2017 76.7 % 146 91.3 T AD Company Netflix Inc. Balance Sheets (in millions) December 31, 2014 through 2018 7 10 20 Other assets 21 Intangibles Other assets 2014 Common-size analysis 2013 2014 2015 2017 2015 20 Total other assets 24 25 Total Assets $ 1,469,754 $ 2,197,869 1.978.173 3 3,678,444 100 0% 100.0 % 100 0% 20 27 Liabilities and Stockholders' Equity 211 29 Current Liabilities Accounts payable S 30 201,581 $ 253,491 $ 312.842 $ 359.555 12.2 % 11.5% 13.7 % Accrued expenses & other current abilities Current portion of debt and leases 312.842 201.581 Total current liabilities 359 555 13.7 11.5 12.2 253.491 prospective analyses discount rate de valuation summary Summary- Start Here balance sheet income statement ratia 22 32 CH $ 2016 2017 100.1% 100.0 % 15.8 % 15.8 2016 98 YA8 F10 A.B. 1 Company Netflix Inc. 7 Balance Sheets (in millions) December 31, 2014 through 2018 Current Liabilities Accounts payable Accrued expenses & other current abilities Current portion of debt and leases Total current liabilities Long-Term Liabilities Long-term debt and lease obligations Other long-term liabilities Total long-term liabilities Total Liabilities Cinaktinidor Emi Summary Start Here 15 10 7 20 31 22 D 34 D 0 2014 5 S 2016 S 2017 Common-ire analysis 2014 2013 122 % 13.7 % 12:2 13.7 201.581 253,491 312.842 359.555 201.581 253,491 312.842 359,555 201.581 253,491 312.842 359.555 122 13.7 0 balance sheet income statement ratios prospective discount safe caution summary 2015 11.5 % 11.5 115 2016 R 15.8 N 15.8 15.8 61 2011 98 % 9.8 Undo 15 fx AB C 1 Company Netflix Inc. 2 Balance Sheets (in millions) 3 December 31, 2014 through 2018 Other long-term labilities Y38 Fort Total long-term liabalties Total Liabilities 41 42 Stockholders' Equity 43 Common stock, less treasury 44 Additional paid in capital) 45 Retained earnings Other comprehensive income (loss) Total Stockholders' Equity Summary 280538 4 D D 2014 201,581 60 1,042,810 819,284 H (4.446) 1.857-708 2,059,289 $ Start Here balance sheet income statement ratios 2015 16 Minde K 2010 M 2017 glei 253,491 312,842 1.324,809 1,599.762 941,925 1,128,603 (43,308) (48,565) 2.223 426 2.679,800 2.476.917 $ 2.992,642 prospective analysis discount ate M 359.555 1,871,396 1,731,117 3.501,956 $ 3.941.511. (20,557) CHE D Common-size analysis 2013 2014 12.2 13.7 87:3 71.0 620 55.7 04 (03) 149.7 126 41 1619 % 140.1 % O valuation surnaacy 2015 11.5 60.3 429 (2.0) 2016 101 2 112.7 % 9 1 158 80.9 14 57/1 Any (25) 135.5 151.3 % 2017 98 50.0 47 1 (0.6) 97.4 1072 % B Company Netflix Inc. Balance Sheets (in millions) December 31, 2014 through 2018 Assets 10 1 Current Assets 2 Cash and cash equivalents 3 Accounts receivable, net 4 Inventory 5 Other current assets 6 Total current assets 7 Property, plant & equipment, net 0 o Other assets Intangibles Other assets Total other assets M 122 2014 S 1.113.608 206,271 1,319,879 149.875 $ ratios 2015 2016 1,809,330 S 1,467,576 $ 215,127 260,202 2.024 457 1,727 778 173,412 250 395 prospective analysis discount ate op Commons analysis 2014 2013 2017 2.822,795 67.9 % 75.8 % 536,245 17.1 14.0 3,359 040 85.0 89.8 319.404 15.0 dif valuation summary 10.2 2015 82.3 % 9.8 92.1 79 74.2 % 132 874 127 2017 76.7 % 146 91.3 T AD Company Netflix Inc. Balance Sheets (in millions) December 31, 2014 through 2018 7 10 20 Other assets 21 Intangibles Other assets 2014 Common-size analysis 2013 2014 2015 2017 2015 20 Total other assets 24 25 Total Assets $ 1,469,754 $ 2,197,869 1.978.173 3 3,678,444 100 0% 100.0 % 100 0% 20 27 Liabilities and Stockholders' Equity 211 29 Current Liabilities Accounts payable S 30 201,581 $ 253,491 $ 312.842 $ 359.555 12.2 % 11.5% 13.7 % Accrued expenses & other current abilities Current portion of debt and leases 312.842 201.581 Total current liabilities 359 555 13.7 11.5 12.2 253.491 prospective analyses discount rate de valuation summary Summary- Start Here balance sheet income statement ratia 22 32 CH $ 2016 2017 100.1% 100.0 % 15.8 % 15.8 2016 98 YA8 F10 A.B. 1 Company Netflix Inc. 7 Balance Sheets (in millions) December 31, 2014 through 2018 Current Liabilities Accounts payable Accrued expenses & other current abilities Current portion of debt and leases Total current liabilities Long-Term Liabilities Long-term debt and lease obligations Other long-term liabilities Total long-term liabilities Total Liabilities Cinaktinidor Emi Summary Start Here 15 10 7 20 31 22 D 34 D 0 2014 5 S 2016 S 2017 Common-ire analysis 2014 2013 122 % 13.7 % 12:2 13.7 201.581 253,491 312.842 359.555 201.581 253,491 312.842 359,555 201.581 253,491 312.842 359.555 122 13.7 0 balance sheet income statement ratios prospective discount safe caution summary 2015 11.5 % 11.5 115 2016 R 15.8 N 15.8 15.8 61 2011 98 % 9.8 Undo 15 fx AB C 1 Company Netflix Inc. 2 Balance Sheets (in millions) 3 December 31, 2014 through 2018 Other long-term labilities Y38 Fort Total long-term liabalties Total Liabilities 41 42 Stockholders' Equity 43 Common stock, less treasury 44 Additional paid in capital) 45 Retained earnings Other comprehensive income (loss) Total Stockholders' Equity Summary 280538 4 D D 2014 201,581 60 1,042,810 819,284 H (4.446) 1.857-708 2,059,289 $ Start Here balance sheet income statement ratios 2015 16 Minde K 2010 M 2017 glei 253,491 312,842 1.324,809 1,599.762 941,925 1,128,603 (43,308) (48,565) 2.223 426 2.679,800 2.476.917 $ 2.992,642 prospective analysis discount ate M 359.555 1,871,396 1,731,117 3.501,956 $ 3.941.511. (20,557) CHE D Common-size analysis 2013 2014 12.2 13.7 87:3 71.0 620 55.7 04 (03) 149.7 126 41 1619 % 140.1 % O valuation surnaacy 2015 11.5 60.3 429 (2.0) 2016 101 2 112.7 % 9 1 158 80.9 14 57/1 Any (25) 135.5 151.3 % 2017 98 50.0 47 1 (0.6) 97.4 1072 %
Step by Step Solution
There are 3 Steps involved in it

Get step-by-step solutions from verified subject matter experts