

Question: Balance sheet and income statement are given below M & G Industries Comparative Balance Sheets 2022 Cash Accts Receiv Inventories Total CA Land Bldg &
Balance sheet and income statement are given below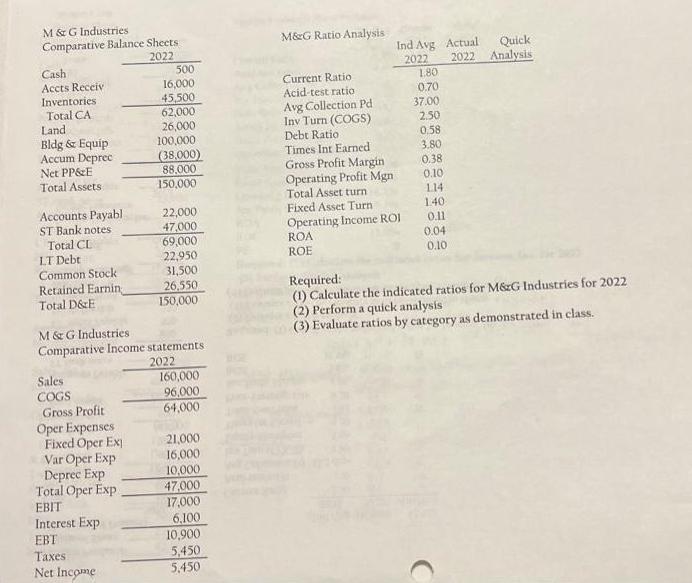
M & G Industries Comparative Balance Sheets 2022 Cash Accts Receiv Inventories Total CA Land Bldg & Equip Accum Deprec Net PP&E Total Assets: Accounts Payabl ST Bank notes Total CL LT Debt: Common Stock Retained Earnin Total D&E Sales COGS Gross Profit Oper Expenses Fixed Oper Ex Var Oper Exp Deprec Exp 500 16,000 45,500 62,000 26,000 Total Oper Exp EBIT Interest Exp EBT Taxes Net Income 100,000 (38,000) 88,000 150,000 M & G Industries Comparative Income statements 2022 22,000 47,000 69,000 22,950 31,500 26,550 150,000 160,000 96,000 64,000 21,000 16,000 10,000 47,000 17,000 6,100 10,900 5,450 5.450 M&G Ratio Analysis Current Ratio Acid-test ratio Avg Collection Pd Inv Turn (COGS) Debt Ratio. Times Int Earned Gross Profit Margin Ind Avg Actual 2022 Operating Profit Mgn Total Asset turn Fixed Asset Turn Operating Income ROI ROA ROE 1.80 0.70 37.00 2.50 0.58 3.80 0.38 0.10 114 1.40 0.11 0.04 0.10 Quick 2022 Analysis Required: (1) Calculate the indicated ratios for M&G Industries for 2022 (2) Perform a quick analysis (3) Evaluate ratios by category as demonstrated in class.
Step by Step Solution
3.48 Rating (158 Votes )
There are 3 Steps involved in it
Liquidity Ratios Current Ratio Total Current Assets Total Current Liabilities 62000 69000 090 Acidte... View full answer

Get step-by-step solutions from verified subject matter experts