

Question: Balance Sheet Current Assets Inventory 2017 2018 782.9 Financial Assets Fixed or Non-Current Assets Total Assets Current Liabilities CAGR example Non-Current Liabilities Total Liabilities
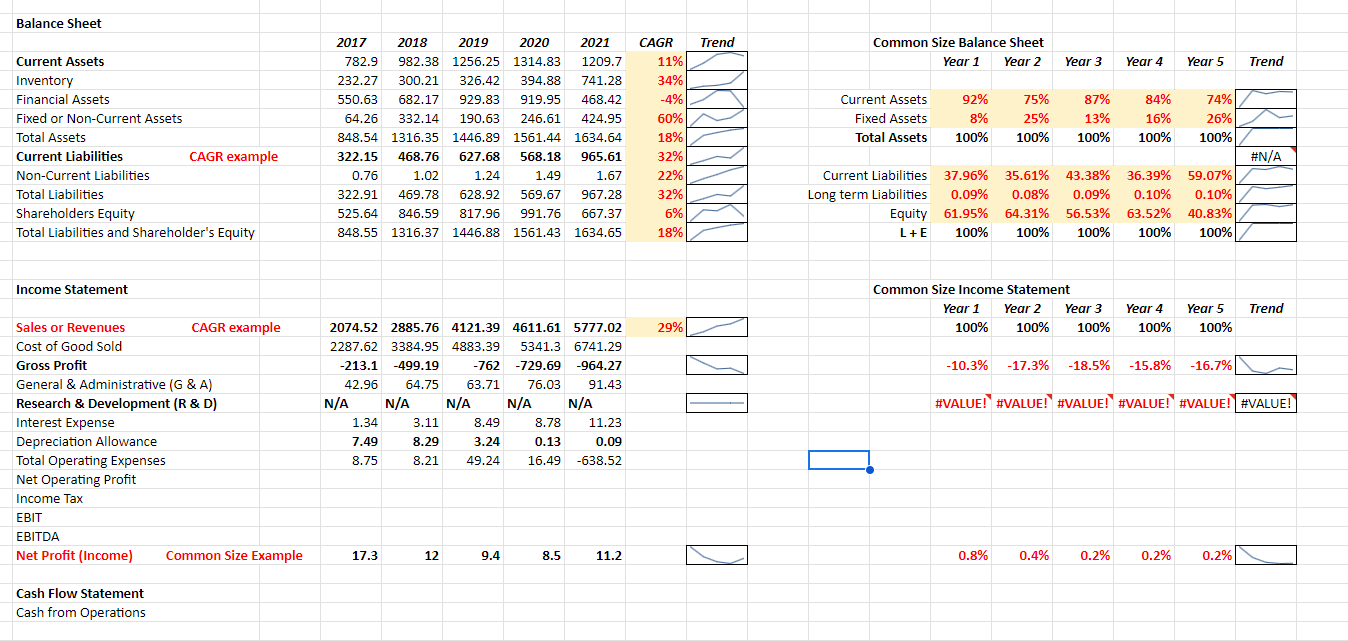
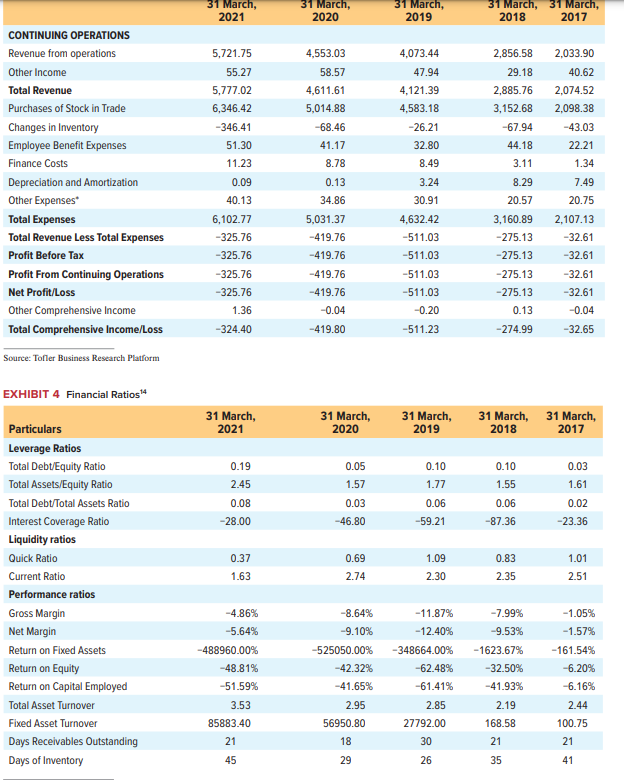
Balance Sheet Current Assets Inventory 2017 2018 782.9 Financial Assets Fixed or Non-Current Assets Total Assets Current Liabilities CAGR example Non-Current Liabilities Total Liabilities Shareholders Equity Total Liabilities and Shareholder's Equity 2019 2020 2021 982.38 1256.25 1314.83 1209.7 232.27 300.21 326.42 394.88 741.28 550.63 682.17 929.83 919.95 468.42 64.26 332.14 190.63 246.61 424.95 848.54 1316.35 1446.89 1561.44 1634.64 322.15 468.76 627.68 568.18 965.61 0.76 1.02 1.24 1.49 322.91 469.78 628.92 569.67 967.28 525.64 846.59 817.96 991.76 667.37 848.55 1316.37 1446.88 1561.43 1634.65 CAGR Trend Common Size Balance Sheet 11% Year 1 Year 2 Year 3 Year 4 Year 5 Trend 34% -4% Current Assets 92% 75% 87% 84% 74% 60% Fixed Assets 8% 25% 13% 16% 26% 18% Total Assets 100% 100% 100% 100% 100% 32% #N/A 1.67 22% 32% 6% 18% Long term Liabilities Equity L+E Current Liabilities 37.96% 35.61% 43.38% 36.39% 59.07% 0.09% 0.08% 0.09% 0.10% 0.10% 61.95% 64.31% 56.53% 63.52% 40.83% 100% 100% 100% 100% 100% Income Statement Common Size Income Statement Sales or Revenues CAGR example Cost of Good Sold Gross Profit -213.1 -499.19 2074.52 2885.76 4121.39 4611.61 5777.02 2287.62 3384.95 4883.39 5341.3 6741.29 -729.69 29% Year 1 Year 2 Year 3 100% 100% 100% Year 4 100% Year 5 Trend 100% -762 -964.27 General & Administrative (G & A) Research & Development (R&D) Interest Expense Depreciation Allowance 42.96 64.75 63.71 76.03 91.43 N/A N/A N/A N/A N/A -10.3% -17.3% -18.5% -15.8% -16.7% #VALUE! #VALUE! #VALUE! #VALUE! #VALUE! #VALUE! 1.34 3.11 8.49 8.78 11.23 7.49 8.29 3.24 0.13 0.09 Total Operating Expenses 8.75 8.21 49.24 16.49 -638.52 Net Operating Profit Income Tax EBIT EBITDA Net Profit (Income) Common Size Example 17.3 12 9.4 8.5 11.2 0.8% 0.4% 0.2% 0.2% 0.2% Cash Flow Statement Cash from Operations CONTINUING OPERATIONS 31 March, 2021 31 March, 2020 31 March, 2019 31 March, 31 March, 2018 2017 Revenue from operations 5,721.75 4,553.03 4,073.44 2,856.58 2,033.90 Other Income 55.27 58.57 47.94 29.18 40.62 Total Revenue 5,777.02 4,611.61 4,121.39 2,885.76 2,074.52 Purchases of Stock in Trade 6,346.42 5,014.88 4,583.18 3,152.68 2,098.38 Changes in Inventory -346.41 -68.46 -26.21 -67.94 -43.03 Employee Benefit Expenses 51.30 41.17 32.80 44.18 22.21 Finance Costs 11.23 8.78 8.49 3.11 1.34 Depreciation and Amortization 0.09 0.13 3.24 8.29 7.49 Other Expenses* 40.13 34.86 30.91 20.57 20.75 Total Expenses 6,102.77 5,031.37 4,632.42 3,160.89 2,107.13 Total Revenue Less Total Expenses -325.76 -419.76 -511.03 -275.13 -32.61 Profit Before Tax -325.76 -419.76 -511.03 -275.13 -32.61 Profit From Continuing Operations -325.76 -419.76 -511.03 -275.13 -32.61 Net Profit/Loss -325.76 -419.76 -511.03 -275.13 -32.61 Other Comprehensive Income 1.36 -0.04 -0.20 0.13 -0.04 Total Comprehensive Income/Loss -324.40 -419.80 -511.23 -274.99 -32.65 Source: Tofler Business Research Platform EXHIBIT 4 Financial Ratios14 Particulars 31 March, 2021 31 March, 2020 31 March, 2019 31 March, 2018 31 March, 2017 Leverage Ratios Total Debt/Equity Ratio 0.19 0.05 0.10 0.10 0.03 Total Assets/Equity Ratio 2.45 1.57 1.77 1.55 1.61 Total Debt/Total Assets Ratio 0.08 0.03 0.06 0.06 0.02 Interest Coverage Ratio -28.00 -46.80 -59.21 -87.36 -23.36 Liquidity ratios Quick Ratio 0.37 0.69 1.09 0.83 1.01 Current Ratio 1.63 2.74 2.30 2.35 2.51 Performance ratios Gross Margin -4.86% -8.64% -11.87% -7.99% -1.05% Net Margin -5.64% -9.10% -12.40% -9.53% -1.57% Return on Fixed Assets -488960.00% -525050.00% -348664.00% -1623.67% -161.54% Return on Equity -48.81% -42.32% -62.48% -32.50% -6.20% Return on Capital Employed -51.59% -41.65% -61.41% -41.93% -6.16% Total Asset Turnover 3.53 2.95 2.85 2.19 2.44 Fixed Asset Turnover 85883.40 56950.80 27792.00 168.58 100.75 Days Receivables Outstanding 21 18 30 21 21 Days of Inventory 45 29 26 35 41
Step by Step Solution
3.37 Rating (163 Votes )
There are 3 Steps involved in it
Certainly Lets break down the provided financial data and ratios 1 Revenue from Operations This represents the income generated from the primary activ... View full answer

Get step-by-step solutions from verified subject matter experts