Question: Balance Sheet v 3 Years/Quarters v | [ Show Footnotes [ As Reported Currency v | [As Reported Scale v| | Refresh | Exchange rate
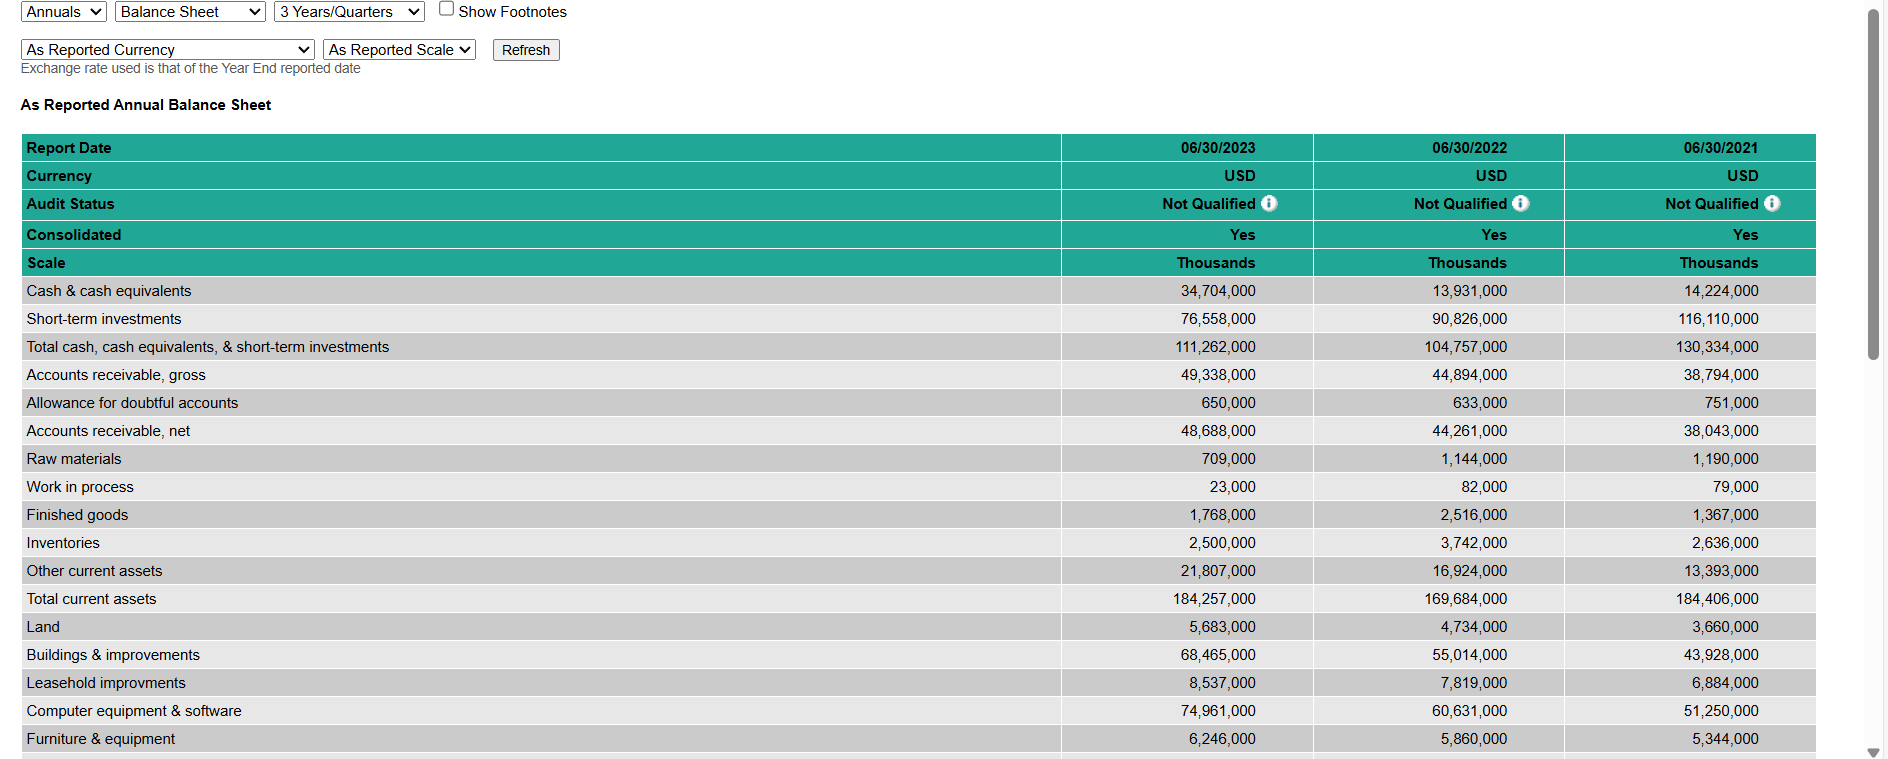
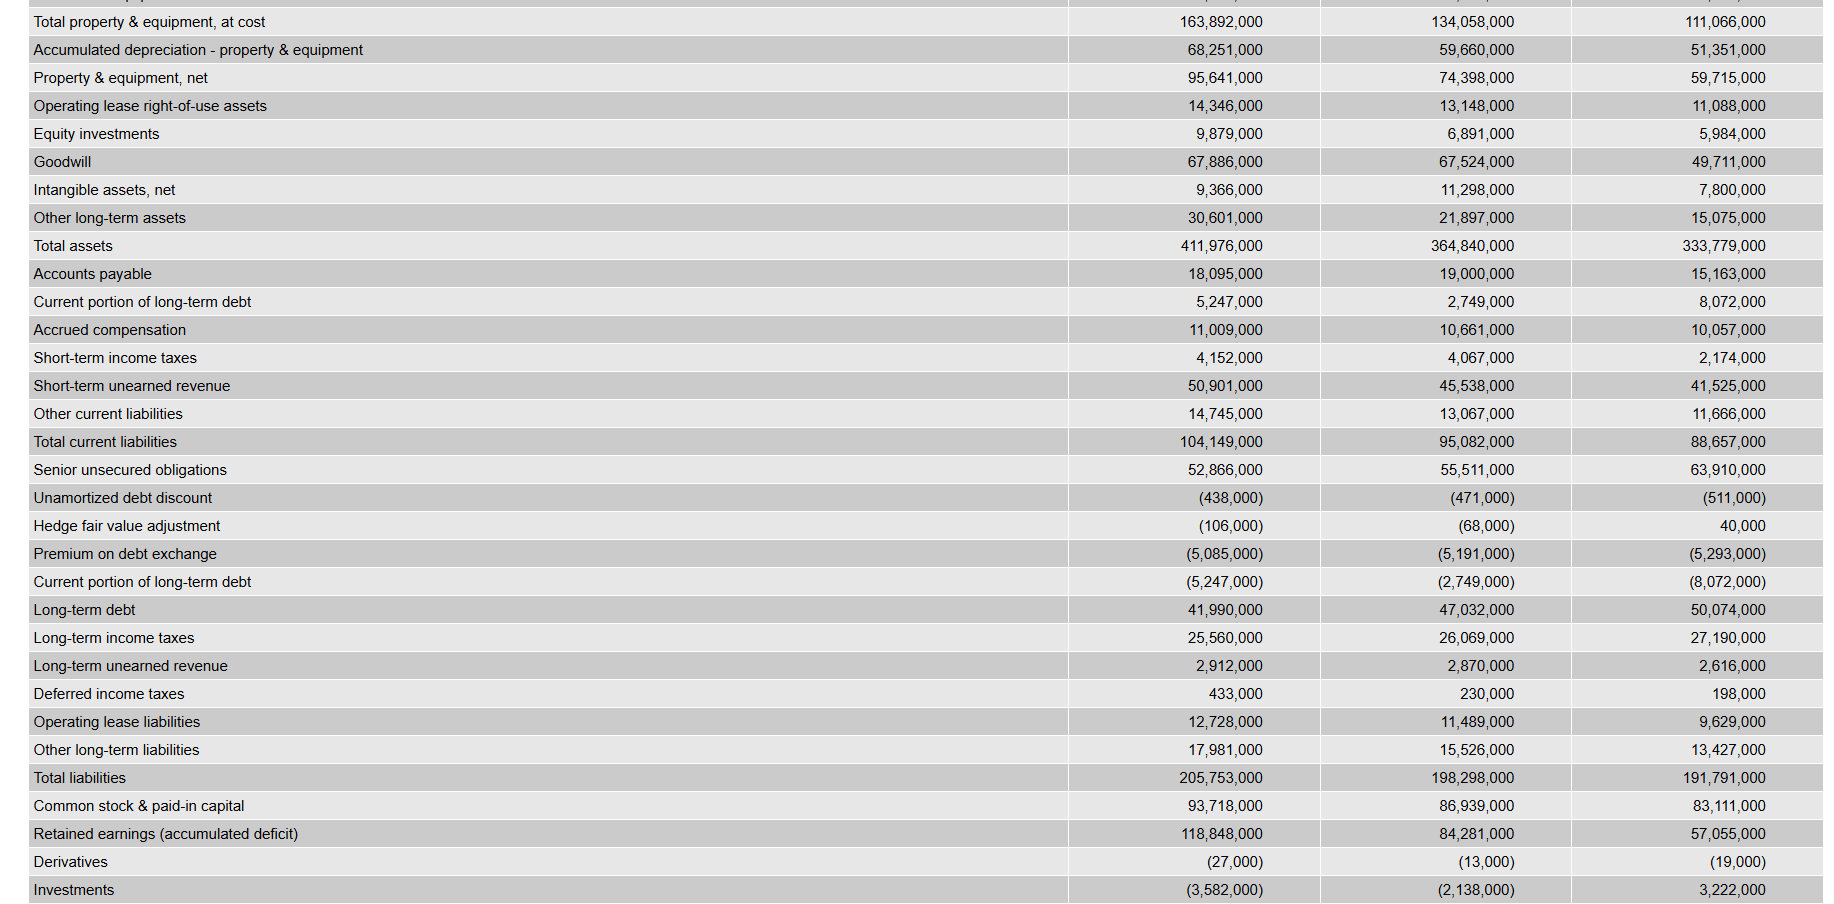
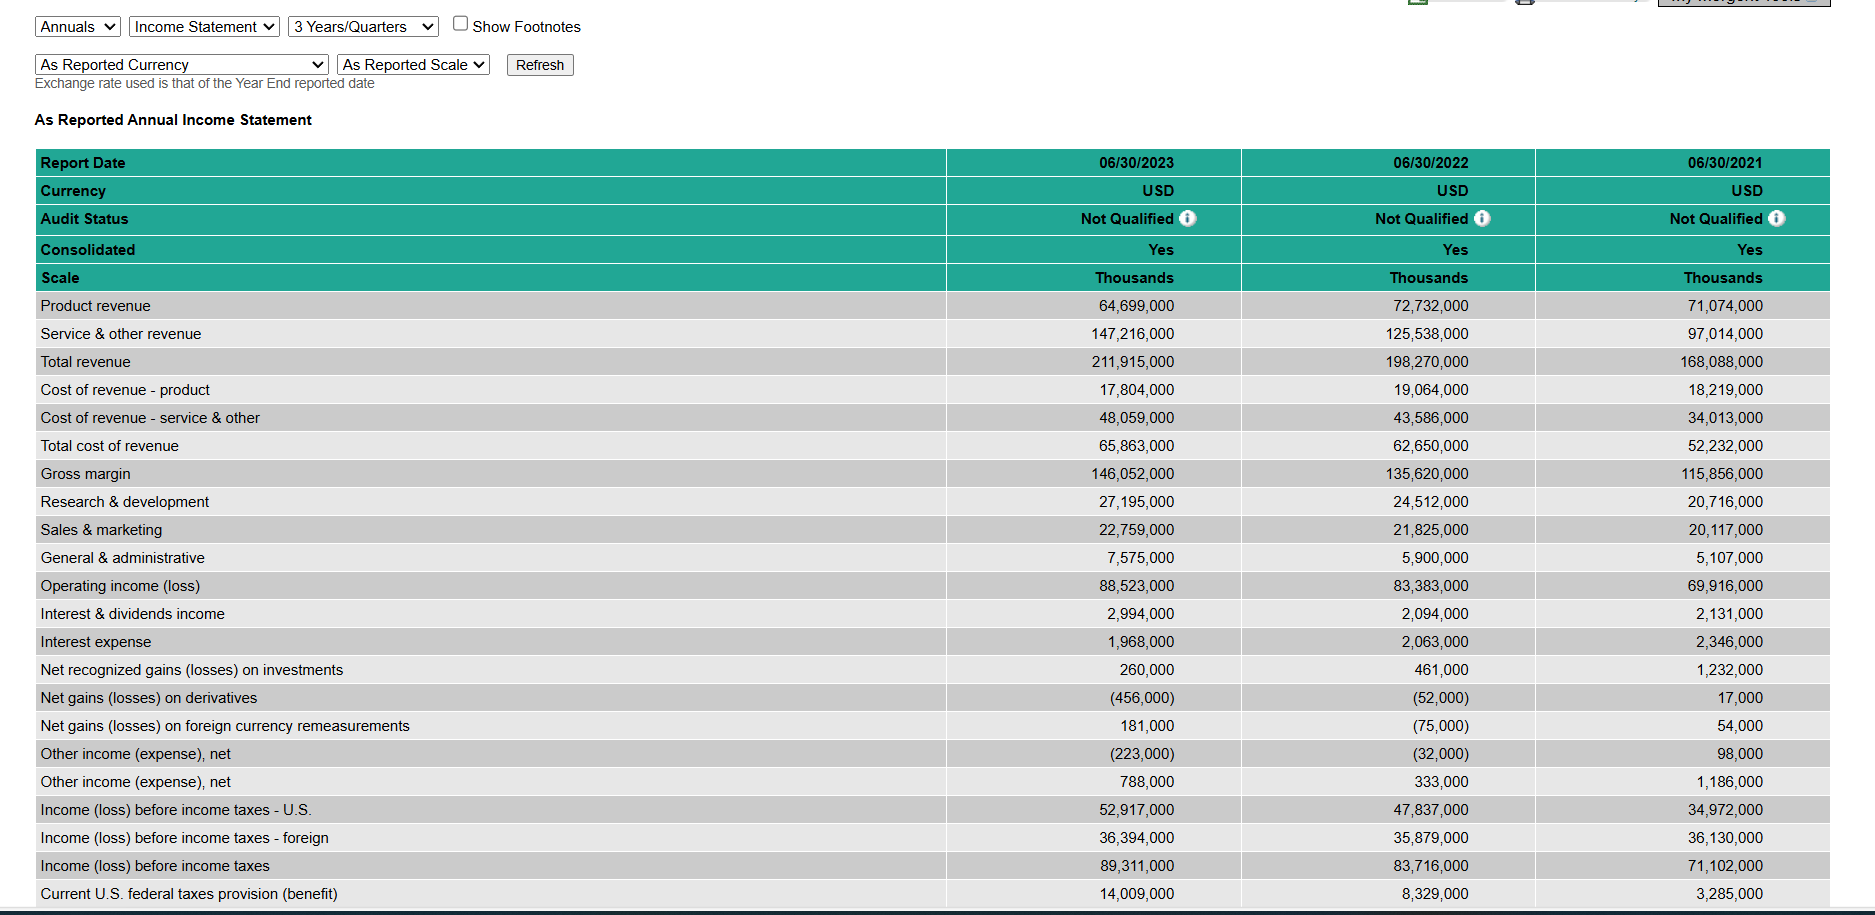
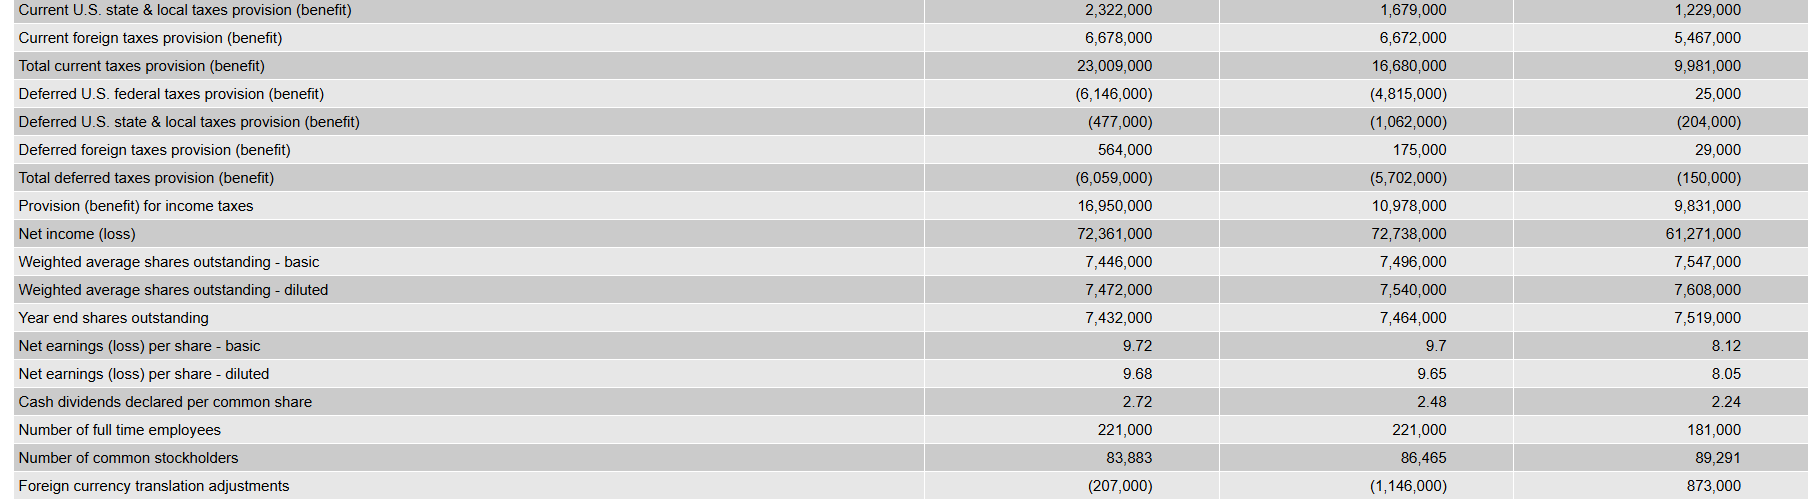
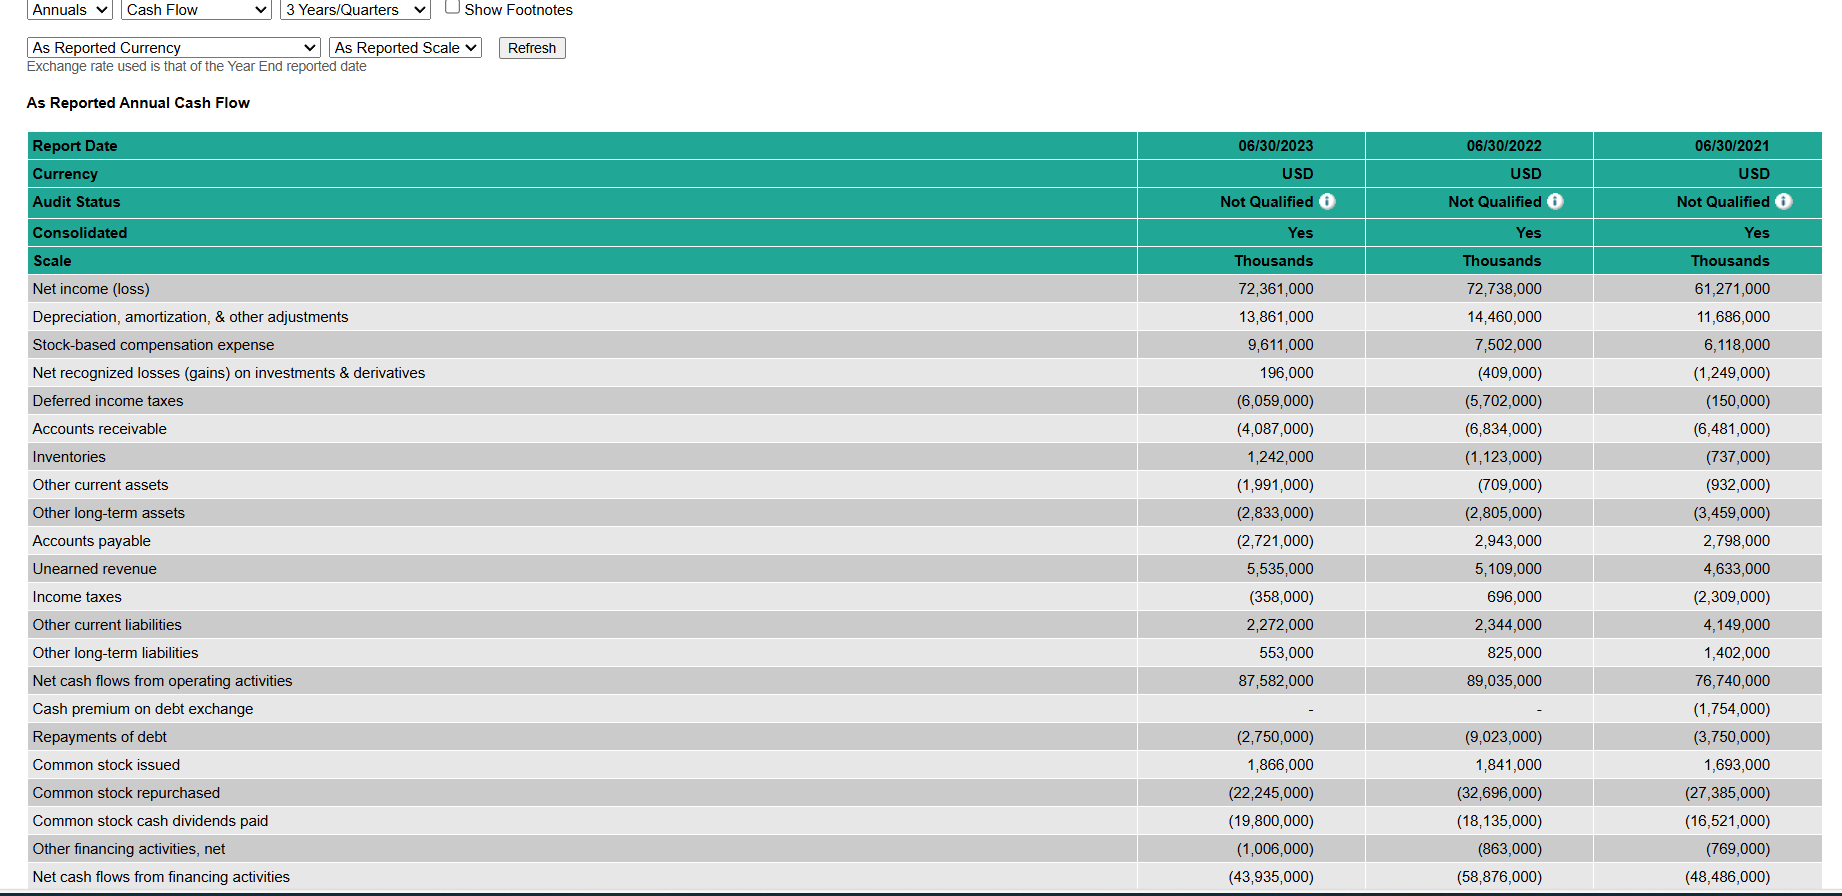
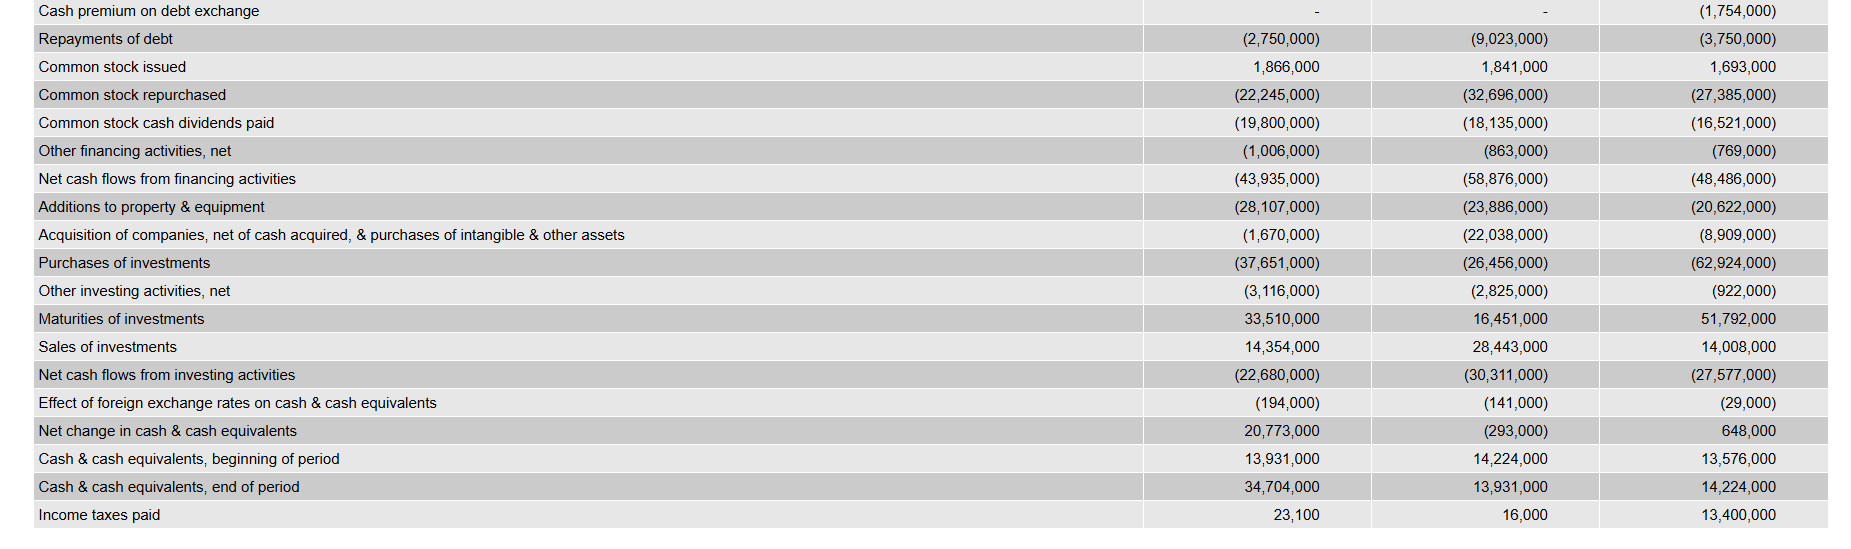
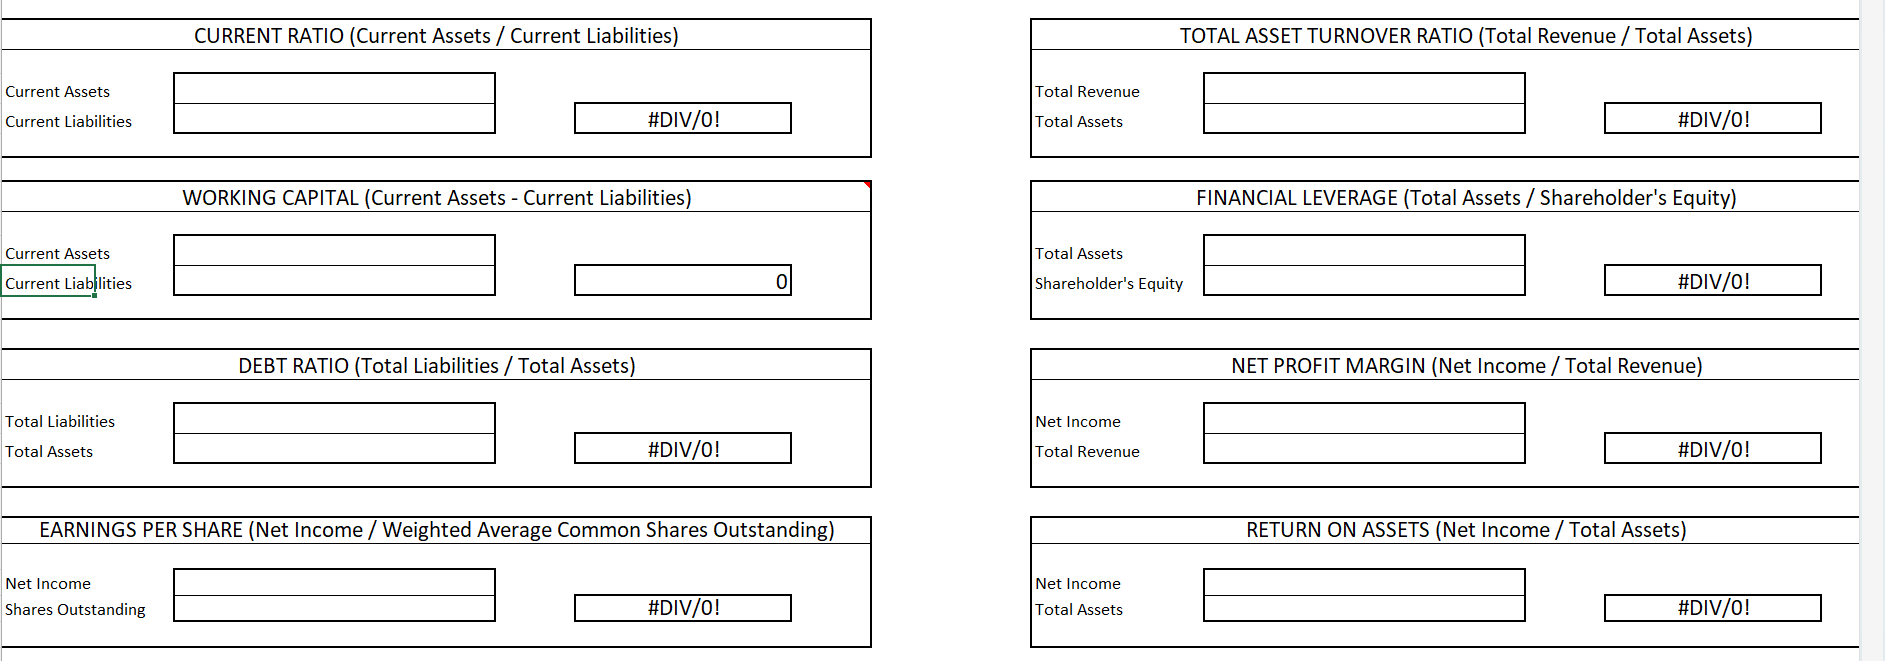
Balance Sheet v 3 Years/Quarters v | [ Show Footnotes [ As Reported Currency v | [As Reported Scale v| | Refresh | Exchange rate used is that of the Year End reported date As Reported Annual Balance Sheet Cash & cash equivalents 34,704,000 13,931,000 14,224,000 Short-term investments 76,558,000 90,826,000 116,110,000 Total cash, cash equivalents, & short-term investments 111,262,000 104,757,000 130,334,000 Accounts receivable, gross 49,338,000 44,894 000 38,794,000 Allowance for doubtful accounts 650,000 633,000 751,000 Accounts receivable, net 48,688,000 44,261,000 38,043,000 Raw materials 709,000 1,144,000 1,190,000 Work in process 23,000 82,000 79,000 Finished goods 1,768,000 2,516,000 1,367,000 Inventories 2,500,000 3,742,000 2,636,000 Other current assets 21,807,000 16,924,000 13,393,000 Total current assets 184,257,000 169,684,000 184,406,000 Land 5,683,000 4,734,000 3,660,000 Buildings & improvements. 68,465,000 55,014,000 43,928,000 Leasehold improvments 8,537,000 7,819,000 6,884,000 Computer equipment & software 74,961,000 60,631,000 51,250,000 Fumiture & equipment 6,246,000 5,860,000 5,344,000 Total property & equipment, at cost 163,892,000 134,058,000 111,066,000 Accumulated depreciation - property & equipment 68,251,000 59,660,000 51,351,000 Property & equipment, net 95,641,000 74,398,000 59,715,000 Operating lease right-of-use assets 14,346,000 13, 148,000 11,088,000 Equity investments 9,879,000 6,891,000 5,984,000 Goodwill 67,886,000 67,524,000 49,711,000 Intangible assets, net 9,366,000 11,298,000 7,800,000 Other long-term assets 30,601,000 21,897,000 15,075,000 Total assets 411,976,000 364,840,000 333,779,000 Accounts payable 18,095,000 19,000,000 15, 163,000 Current portion of long-term debt 5,247,000 2,749,000 8,072,000 Accrued compensation 11,009,000 10,661,000 10,057,000 Short-term income taxes 4, 152,000 4,067,000 2, 174,000 Short-term unearned revenue 50,901,000 45,538,000 41,525,000 Other current liabilities 14,745,000 13,067,000 11,666,000 Total current liabilities 104, 149,000 95, 082,000 88,657,000 Senior unsecured obligations 52,866,000 55,511,000 63,910,000 Unamortized debt discount (438,000) (471,000) (511,000) Hedge fair value adjustment (106,000) (68,000) 40,000 Premium on debt exchange (5,085,000) (5, 191,000) (5,293,000) Current portion of long-term debt (5,247,000) (2,749,000) (8,072,000) Long-term debt 41,990,000 47,032,000 50,074,000 Long-term income taxes 25,560,000 26,069,000 27, 190,000 Long-term unearned revenue 2,912,000 2,870,000 2,616,000 Deferred income taxes 433,000 230,000 198,000 Operating lease liabilities 12,728,000 11,489,000 9,629,000 Other long-term liabilities 17,981,000 15,526,000 13,427,000 Total liabilities 205,753,000 198,298,000 191,791,000 Common stock & paid-in capital 93,718,000 86,939,000 83, 111,000 Retained earnings (accumulated deficit) 118,848,000 84,281,000 57,055,000 Derivatives (27,000) (13,000) (19,000) Investments (3,582,000) (2, 138,000) 3,222,000Translation adjustments & other accumulated other comprehensive income (2,734,000) Total stockhelders' equity (deficit) (2,527,000) (1,381,000) 206,223,000 166,542,000 141,988,000 Income Statement v | [ 3 Years/Quarters v | [ Show Footnotes |As Reported Currency v\\ \\As Reported Scale v\\ ' Refresh Exchange rate used is that o the Year End reported date As Reported Annual Income Statement Product revenue 64,699,000 72,732,000 71,074,000 Service & other revenue 147,216,000 125,538,000 97,014,000 Total revenue 211,915,000 198,270,000 168,088,000 Cost of revenue - product 17,804,000 19,064,000 18,219,000 Cost of revenue - service & other 48,059,000 43,586,000 34,013,000 Total cost of revenue 65,863,000 62,650,000 52,232,000 Gross margin 146,052,000 135,620,000 115,856,000 Research & development 27,195,000 24,512,000 20,716,000 Sales & marketing 22,759,000 21,825,000 20,117,000 General & administrative 7,575,000 5,900,000 5,107,000 Operating income (loss) 88,523,000 83,383,000 69,916,000 Interest & dividends income: 2,994,000 2,094,000 2,131,000 Interest expense 1,968,000 2,063,000 2,346,000 Net recognized gains (losses) on investments 260,000 461,000 1,232,000 Net gains (losses) on derivatives (456,000) (52,000) 17,000 Net gains (losses) on foreign currency remeasurements 181,000 (75,000) 54,000 Other income (expense), net (223,000) (32,000) 98,000 Other income (expense), net 788,000 333,000 1,186,000 Income (loss) before income taxes - US. 52,917,000 47,837,000 34,972,000 Income (loss) before income taxes - foreign 36,394,000 35,879,000 36,130,000 Income (loss) before income taxes 89,311,000 83,716,000 71,102,000 Current U.S. federal taxes provision (benefit) 14,009,000 8,329,000 3,285,000 Current U.S. state & local taxes provision (benefit) 2,322,000 1,679,000 1,229,000 Current foreign taxes provision (benefit) 6,678,000 6,672,000 5,467,000 Total current taxes provision (benefit) 23,009,000 16,680,000 9,981,000 Deferred U.S. federal taxes provision (benefit) (6, 146,000) (4,815,000) 25,000 Deferred U.S. state & local taxes provision (benefit) (477,000) (1,062,000) (204,000) Deferred foreign taxes provision (benefit) 564,000 175,000 29,000 Total deferred taxes provision (benefit) (6,059,000) (5,702,000) (150,000) Provision (benefit) for income taxes 16,950,000 10,978,000 9,831,000 Net income (loss) 72,361,000 72,738,000 61,271,000 Weighted average shares outstanding - basic 7,446,000 7,496,000 7,547,000 Weighted average shares outstanding - diluted 7,472,000 7,540,000 7,608,000 Year end shares outstanding 7,432,000 7,464,000 7,519,000 Net earnings (loss) per share - basic 9.72 9.7 B. 12 Net earnings (loss) per share - diluted 9.68 9.65 8.05 Cash dividends declared per common share 2.72 2.48 2.24 Number of full time employees 221,000 221,000 181,000 Number of common stockholders 83,883 86,465 89,291 Foreign currency translation adjustments (207,000) (1, 146,000) 873,000| Annuals v | | Cash Flow v| |3 YearsiQuarters v| L Shew Footnotes \\ As Reported Currency v\\ |As Reported Scale V| ' Refresh Exchange rate used is that of the Year End reported date As Reported Annual Cash Flow Net income (loss) 72,361,000 72,738,000 61,271,000 Depreciation, amortization, & other adjustments 13,861,000 14,460,000 11,686,000 Stock-based compensation expense 9,611,000 7,502,000 6,118,000 Net recognized losses (gains) on investments & derivatives 196,000 (409,000) (1,249,000) Deferred income taxes (6,059,000) (5,702,000) (150,000) Accounts receivable (4,087,000) (8,834,000) (6,481,000) Inventories 1,242,000 (1,123,000) (737,000) Other current assets (1,991,000) (709.000) (932,000) Other long-term assets (2,833,000) (2,805,000) (3,459,000) Accounts payable (2,721,000) 2,943,000 2,798,000 Unearned revenue 5,535,000 5,109,000 4,633,000 Income taxes (358,000) 696,000 (2,309,000) Other current liabilities 2,272,000 2,344 000 4,149,000 Other long-term liabilities 553,000 825,000 1,402,000 Net cash flows from operating activities 87,582,000 89,035,000 76,740,000 Cash premium on debt exchange - - (1,754,000) Repayments of debt (2,750,000) (9,023,000) (3,750,000) Common stock issued 1,866,000 1,841,000 1,693,000 Common stock repurchased (22,245,000) (32,696,000) (27,385,000) Commoen stock cash dividends paid (19,800,000) (18,135,000) (16,521,000) Other financing activities, net (1,006,000) (863,000) (769,000) Net cash flows from financing activities (43,935,000) (68,876,000) (48,486,000) Cash premium on debt exchange - - (1,754,000) Common stock issued 1,866,000 1,841,000 1,693,000 Commen stock cash dividends paid (19,800,000} (18,135,000) (16,521,000) Net cash flows from financing activities (43,935,000) (58,876,000) (48,486,000) Acquisition of companies, net of cash acquired, & purchases of intangible & other assets (1,670,000) (22,038,000) (8,909,000) Other investing activities, net (3,116,000) (2,825,000) (922,000) Sales of investments 14,354,000 28,443,000 14,008,000 Effect of foreign exchange rates on cash & cash equivalents (194,000) (141,000) (29,000) Cash & cash equivalents, beginning of period 13,931,000 14,224,000 13,576,000 Income taxes paid 23,100 16,000 13,400,000 CURRENT RATIO (Current Assets / Current Liabilities) TOTAL ASSET TURNOVER RATIO (Total Revenue / Total Assets) Current Assets Total Revenue Current Liabilities #DIV/0! Total Assets #DIV/0! FINANCIAL LEVERAGE (Total Assets / Shareholder's Equity) WORKING CAPITAL (Current Assets - Current Liabilities) Current Assets Current Liahllhies 0 Total Assets Shareholder's Equity D|V/0! DEBT RATIO (Total Liabilities / Total Assets) NET PROFIT MARGIN (Net Income / Total Revenue) Total Liabilities Net Income Total Assets #DIV/0! Total Revenue #DIV/0! EARNINGS PER SHARE (Net Income / Weighted Average Common Shares Outstanding) RETURN ON ASSETS (Net Income / Total Assets) Net Income Net Income Shares Outstanding DN/O! Total Assets D|V/0! PRICE EARNINGS RATIO (Share Price (end of quarter / EPS) RETURN ON EQUITY (Net Income - Preferred Dividends / Shareholder's Equity) Stock Price EPS #DIV/0! NI - Pref. Div. Shareholder's Equity #DIV/0
Step by Step Solution
There are 3 Steps involved in it
1 Expert Approved Answer
Step: 1 Unlock
Question Has Been Solved by an Expert!
Get step-by-step solutions from verified subject matter experts
Step: 2 Unlock
Step: 3 Unlock
Students Have Also Explored These Related Accounting Questions!