

Question: B)Although in class we suggested scaling variables when building nonlinear models, let us keep it simple and just create a new variable (Torque) 2 .
B)Although in class we suggested scaling variables when building nonlinear models, let us keep it simple and just create a new variable (Torque)2. - Copy the variables Hybrid to AvgMPG from question 3d into a new sheet. - Insert a new column adjacent to Torque and label it T2. - Assuming Torque is in column C and T2 is in column D, in cell D2 enter the formula =C2^2 and copy this formula into all cells in column D. - Fit a new model that includes all terms in Q3d as well as this new variable T2. Request Residuals and Residual Plot for this model. - Copy the Regression Summary Output into your assignment. Do not copy the Residual Output or the Residual Chart
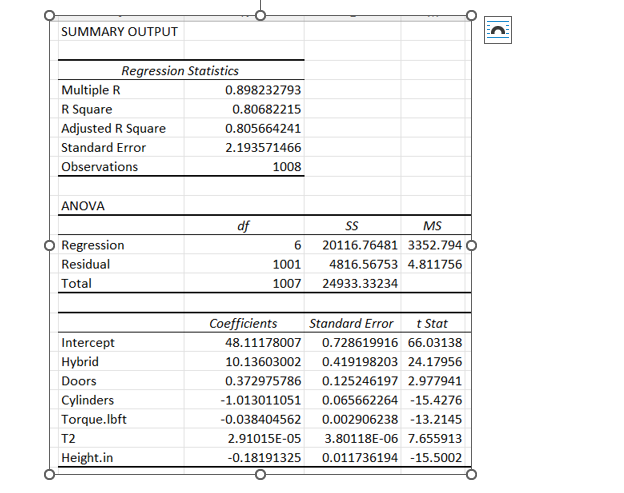
c)
Did adding this squared term for Torque improve the model? Justify your answer.
D)
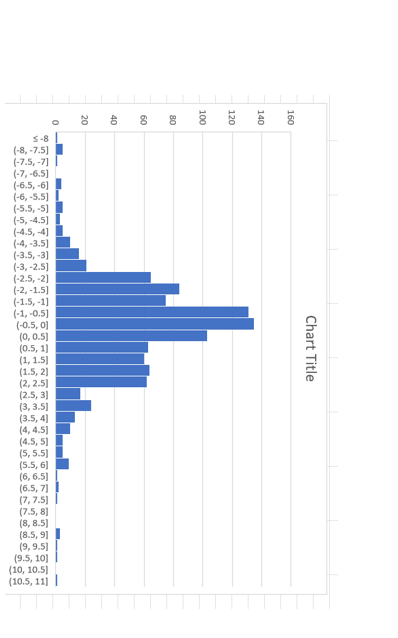
It is possible to make some small further improvements in the model by adding more numeric and categorical variables as well as looking at nonlinearities or possibly interactions among variables. We have suggested that predictions with any model are usually within 2 standard errors. Our standard error is now close to 2mpg, so our prediction errors should be within 4mpg most of the time. Are they? Select the Residuals and Insert a Histogram. We only want the chart and not the frequency distribution, so you do not need to go to Data Analysis and using the Histogram function. The scale is awful though. - Select the horizontal labels and right click. - Select Format Axis. - Click on Bin Width and enter 0.5. - Click on Underflow bin and enter -8.0. This should give you a chart with a scale that you can interpret. The middle of the chart should be 0, since residuals should be centred around 0. Paste a copy of your chart into your assignment.
E)
In your opinion, are most residuals (prediction errors) between -4 and +4? Does the general guidance that most predictions are within 2 standard errors seem reasonable?
can you please solve c and E ?
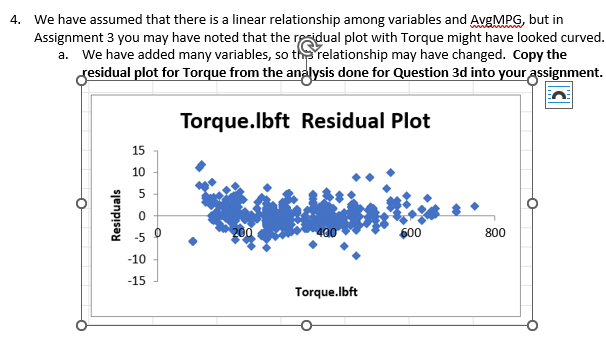
4. We have assumed that there is a linear relationship among variables and AvgMPG, but in Assignment 3 you may have noted that the ropidual plot with Torque might have looked curved a. We have added many variables, so th. relationship may have changed. Copy the residual plot for Torque from the andlysis done for Question 3d into your assignment. ANOVA Chart Title 4. We have assumed that there is a linear relationship among variables and AvgMPG, but in Assignment 3 you may have noted that the ropidual plot with Torque might have looked curved a. We have added many variables, so th. relationship may have changed. Copy the residual plot for Torque from the andlysis done for Question 3d into your assignment. ANOVA Chart Title
Step by Step Solution
There are 3 Steps involved in it

Get step-by-step solutions from verified subject matter experts