Question: BANA 3000 Operations Efficiency Homework Create in Microsoft Excel, a template that does the following: Column A - Your Company's Quantity Produced/Total Cost Column B

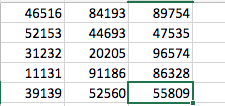
BANA 3000 Operations Efficiency Homework Create in Microsoft Excel, a template that does the following: Column A - Your Company's Quantity Produced/Total Cost Column B - A Competitor/Complement Company's Sales/Total Revenue Column C- Your Company's Overhead Cost Use your yellow sticky number to find the "block" of random numbers, on your random number table. That first block of random numbers will be your Column A, the block right below that, will be your Column B, the block right below that will be your Column C. In Excel, under Formulas, More Functions, Statistical, Correl-do a correlation coefficient for Your Company's Q/TC and Competitor/Complement Company's Sales/TR. Then do another correlation coefficient for Your Company's Q/TC and Your Company's Overhead Cost. State which variable is the most correlated to Your Company's Q/TC. Set up Excel formula that states the average for each column, in the cell right below the last value of each column. Then create, in Excel, a brief Income Statement: Your Budgeted Revenue set up Excel formula so this is 1.5 timas "Your Total Cost" (Your Total Cost) set up Excel formula so this is 85 times the average of the most correlated variable Your Net Income 46516 52153 31232 11131 39139 84193 44693 20205 91186 52560 89754 47535 96574 86328 55809 BANA 3000 Operations Efficiency Homework Create in Microsoft Excel, a template that does the following: Column A - Your Company's Quantity Produced/Total Cost Column B - A Competitor/Complement Company's Sales/Total Revenue Column C- Your Company's Overhead Cost Use your yellow sticky number to find the "block" of random numbers, on your random number table. That first block of random numbers will be your Column A, the block right below that, will be your Column B, the block right below that will be your Column C. In Excel, under Formulas, More Functions, Statistical, Correl-do a correlation coefficient for Your Company's Q/TC and Competitor/Complement Company's Sales/TR. Then do another correlation coefficient for Your Company's Q/TC and Your Company's Overhead Cost. State which variable is the most correlated to Your Company's Q/TC. Set up Excel formula that states the average for each column, in the cell right below the last value of each column. Then create, in Excel, a brief Income Statement: Your Budgeted Revenue set up Excel formula so this is 1.5 timas "Your Total Cost" (Your Total Cost) set up Excel formula so this is 85 times the average of the most correlated variable Your Net Income 46516 52153 31232 11131 39139 84193 44693 20205 91186 52560 89754 47535 96574 86328 55809


