

Question: Bar Chart sker Piot O Stem and leaf plot QUESTION 5 The box plot shows the number of students in different mathematics classes at
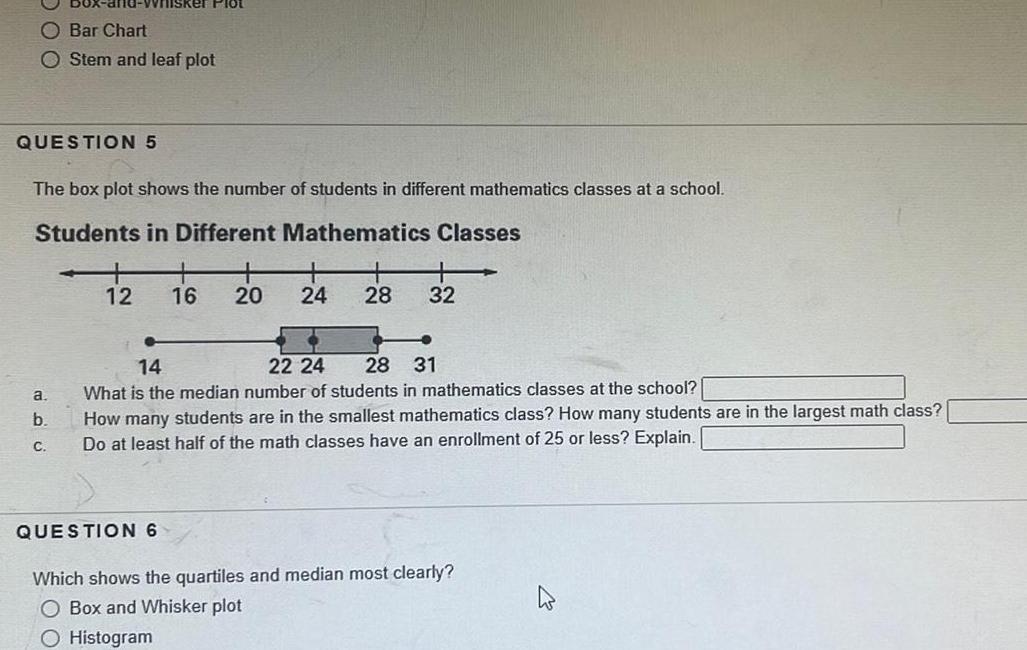
Bar Chart sker Piot O Stem and leaf plot QUESTION 5 The box plot shows the number of students in different mathematics classes at a school. Students in Different Mathematics Classes 12 16 20 24 28 32 14 22 24 28 31 a What is the median number of students in mathematics classes at the school? b. C. How many students are in the smallest mathematics class? How many students are in the largest math class? Do at least half of the math classes have an enrollment of 25 or less? Explain. QUESTION 6 Which shows the quartiles and median most clearly? O Box and Whisker plot O Histogram
Step by Step Solution
There are 3 Steps involved in it
1 Expert Approved Answer
Step: 1 Unlock

Question Has Been Solved by an Expert!
Get step-by-step solutions from verified subject matter experts
Step: 2 Unlock
Step: 3 Unlock