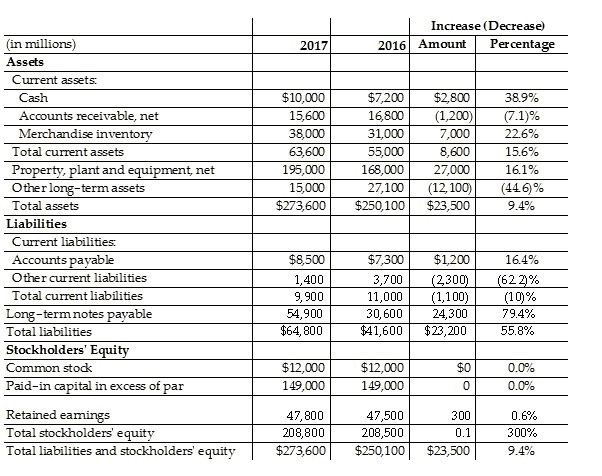
Question: Barn Owl, Inc. reported the following data: The horizontal analysis shows that the amount of total liabilities has _ Increase (Decrease) (in millions) 2017 2016

Barn Owl, Inc. reported the following data: The horizontal analysis shows that the amount of total liabilities has _

Barn Owl, Inc. reported the following data: The
Increase (Decrease) (in millions) 2017 2016 Amount Percentage Assets Current assets: Cash $10,000 $7,200 $2,800 38.9% Accounts receivable, net 15,600 16,800 (1,200) (7.1)% Merchandise inventory 38,000 31,000 7,000 22.6% Total current assets 63,600 55,000 8,600 15.6% Property, plant and equipment, net 195,000 168,000 27,000 16.1% Other long-term assets 15,000 27,100 (12, 100) (446)% Total assets $273,600 $250,100 $23,500 9.4% Liabilities Current liabilities. Accounts payable $8,500 $7,300 $1,200 16.4% Other current liabilities 1,400 3,700 (2,300) (62 2)% Total current liabilities 9,900 11,000 (1,100) (10)% Long-term notes payable 54,900 30,600 24,300 79.4% Total liabilities $64, 800 $41,600 $23,200 55.8% Stockholders' Equity Common stock $12,000 $12,000 0.0% Paid-in capital in excess of par 149,000 149,000 0 0.0% Retained earnings 47,800 47,500 300 0.6% Total stockholders' equity 208,800 208,500 D.1 300% Total liabilities and stockholders' equity $273,600 $250,100 $23,500 9.4%

Step by Step Solution

There are 3 Steps involved in it

1 Expert Approved Answer
Step: 1 Unlock blur-text-image
Question Has Been Solved by an Expert!

Get step-by-step solutions from verified subject matter experts

Step: 2 Unlock
Step: 3 Unlock

Students Have Also Explored These Related Accounting Questions!