

Question: Base on the data collected about etsy and Shopify answer the following questions: which metrics/area would you focus on to improve the performance of both
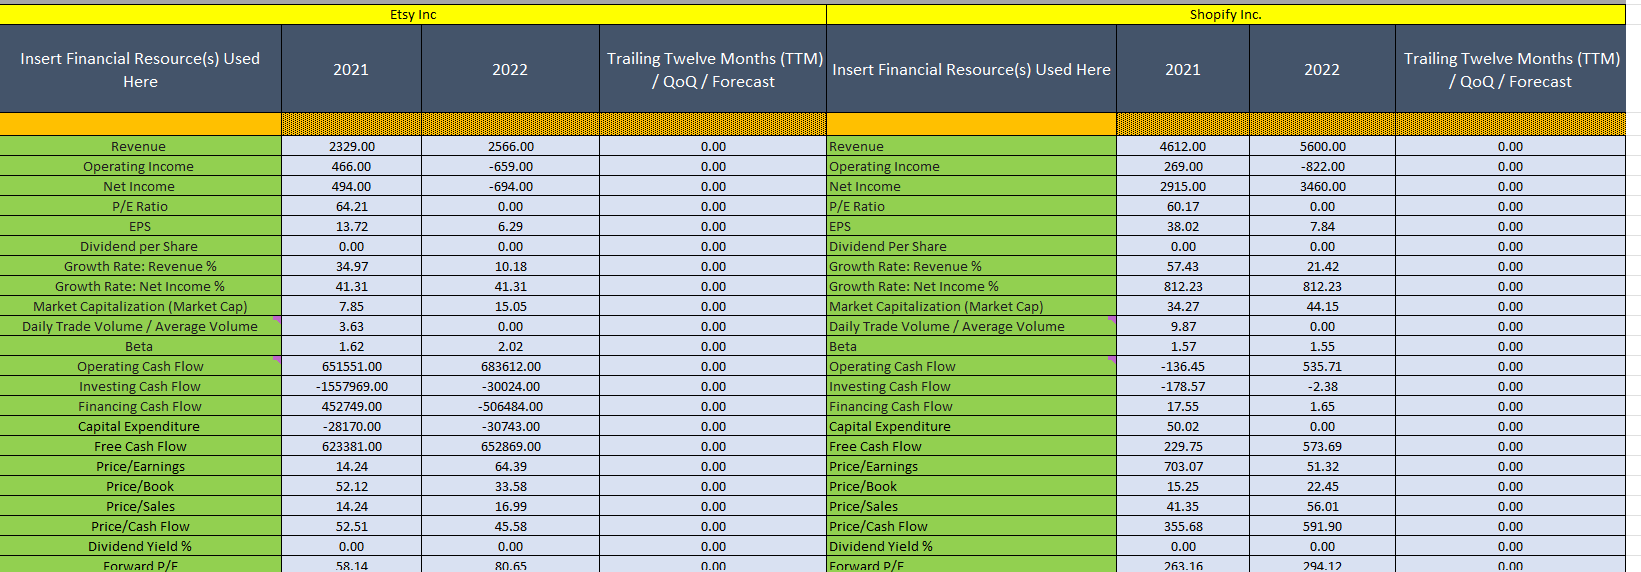
Base on the data collected about etsy and Shopify
answer the following questions:
- which metrics/area would you focus on to improve the performance of both company?
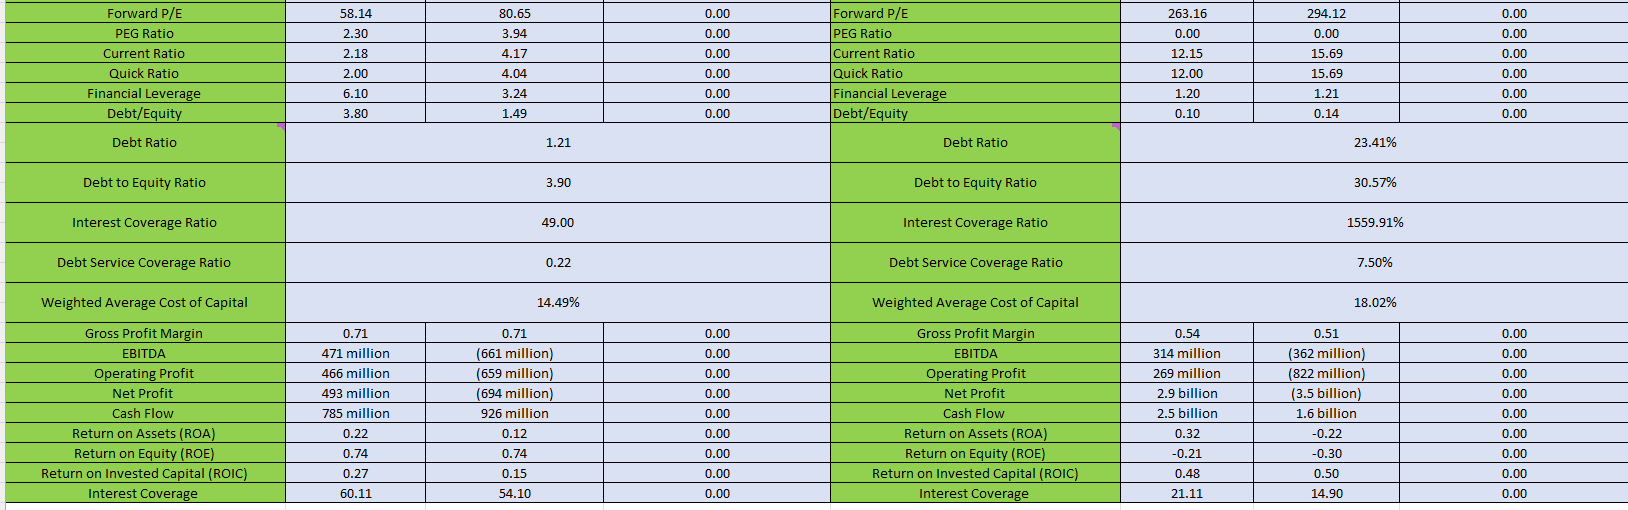
\begin{tabular}{|c|c|c|c|c|c|c|c|} \hline Forward P/E & 58.14 & 80.65 & 0.00 & Forward P/E & 263.16 & 294.12 & 0.00 \\ \hline PEG Ratio & 2.30 & 3.94 & 0.00 & PEG Ratio & 0.00 & 0.00 & 0.00 \\ \hline Current Ratio & 2.18 & 4.17 & 0.00 & Current Ratio & 12.15 & 15.69 & 0.00 \\ \hline Quick Ratio & 2.00 & 4.04 & 0.00 & Quick Ratio & 12.00 & 15.69 & 0.00 \\ \hline \begin{tabular}{l} Financial Leverage \\ \end{tabular} & 6.10 & 3.24 & 0.00 & \begin{tabular}{l} Financial Leverage \\ \end{tabular} & 1.20 & 1.21 & 0.00 \\ \hline Debt/Equity & 3.80 & 1.49 & 0.00 & Debt/Equity & 0.10 & 0.14 & 0.00 \\ \hline Debt Ratio & \multicolumn{3}{|c|}{1.21} & Debt Ratio & \multicolumn{3}{|c|}{23.41%} \\ \hline Debt to Equity Ratio & \multicolumn{3}{|c|}{3.90} & Debt to Equity Ratio & \multicolumn{3}{|c|}{30.57%} \\ \hline Interest Coverage Ratio & \multicolumn{3}{|c|}{49.00} & Interest Coverage Ratio & \multicolumn{3}{|c|}{1559.91%} \\ \hline Debt Service Coverage Ratio & \multicolumn{3}{|c|}{0.22} & Debt Service Coverage Ratio & \multicolumn{3}{|c|}{7.50%} \\ \hline Weighted Average Cost of Capital & \multicolumn{3}{|c|}{14.49%} & Weighted Average Cost of Capital & \multicolumn{3}{|c|}{18.02%} \\ \hline Gross Profit Margin & 0.71 & 0.71 & 0.00 & Gross Profit Margin & 0.54 & 0.51 & 0.00 \\ \hline EBITDA & 471 million & (661 million) & 0.00 & EBITDA & 314 million & (362 million) & 0.00 \\ \hline Operating Profit & 466 million & (659 million) & 0.00 & Operating Profit & 269 million & (822 million) & 0.00 \\ \hline Net Profit & 493 million & (694 million) & 0.00 & Net Profit & 2.9 billion & (3.5 billion) & 0.00 \\ \hline Cash Flow & 785 million & 926 million & 0.00 & Cash Flow & 2.5 billion & 1.6 billion & 0.00 \\ \hline Return on Assets (ROA) & 0.22 & 0.12 & 0.00 & Return on Assets (ROA) & 0.32 & -0.22 & 0.00 \\ \hline Return on Equity (ROE) & 0.74 & 0.74 & 0.00 & Return on Equity (ROE) & -0.21 & -0.30 & 0.00 \\ \hline Return on Invested Capital (ROIC) & 0.27 & 0.15 & 0.00 & Return on Invested Capital (ROIC) & 0.48 & 0.50 & 0.00 \\ \hline Interest Coverage & 60.11 & 54.10 & 0.00 & Interest Coverage & 21.11 & 14.90 & 0.00 \\ \hline \end{tabular} \begin{tabular}{|c|c|c|c|c|c|c|c|} \hline Forward P/E & 58.14 & 80.65 & 0.00 & Forward P/E & 263.16 & 294.12 & 0.00 \\ \hline PEG Ratio & 2.30 & 3.94 & 0.00 & PEG Ratio & 0.00 & 0.00 & 0.00 \\ \hline Current Ratio & 2.18 & 4.17 & 0.00 & Current Ratio & 12.15 & 15.69 & 0.00 \\ \hline Quick Ratio & 2.00 & 4.04 & 0.00 & Quick Ratio & 12.00 & 15.69 & 0.00 \\ \hline \begin{tabular}{l} Financial Leverage \\ \end{tabular} & 6.10 & 3.24 & 0.00 & \begin{tabular}{l} Financial Leverage \\ \end{tabular} & 1.20 & 1.21 & 0.00 \\ \hline Debt/Equity & 3.80 & 1.49 & 0.00 & Debt/Equity & 0.10 & 0.14 & 0.00 \\ \hline Debt Ratio & \multicolumn{3}{|c|}{1.21} & Debt Ratio & \multicolumn{3}{|c|}{23.41%} \\ \hline Debt to Equity Ratio & \multicolumn{3}{|c|}{3.90} & Debt to Equity Ratio & \multicolumn{3}{|c|}{30.57%} \\ \hline Interest Coverage Ratio & \multicolumn{3}{|c|}{49.00} & Interest Coverage Ratio & \multicolumn{3}{|c|}{1559.91%} \\ \hline Debt Service Coverage Ratio & \multicolumn{3}{|c|}{0.22} & Debt Service Coverage Ratio & \multicolumn{3}{|c|}{7.50%} \\ \hline Weighted Average Cost of Capital & \multicolumn{3}{|c|}{14.49%} & Weighted Average Cost of Capital & \multicolumn{3}{|c|}{18.02%} \\ \hline Gross Profit Margin & 0.71 & 0.71 & 0.00 & Gross Profit Margin & 0.54 & 0.51 & 0.00 \\ \hline EBITDA & 471 million & (661 million) & 0.00 & EBITDA & 314 million & (362 million) & 0.00 \\ \hline Operating Profit & 466 million & (659 million) & 0.00 & Operating Profit & 269 million & (822 million) & 0.00 \\ \hline Net Profit & 493 million & (694 million) & 0.00 & Net Profit & 2.9 billion & (3.5 billion) & 0.00 \\ \hline Cash Flow & 785 million & 926 million & 0.00 & Cash Flow & 2.5 billion & 1.6 billion & 0.00 \\ \hline Return on Assets (ROA) & 0.22 & 0.12 & 0.00 & Return on Assets (ROA) & 0.32 & -0.22 & 0.00 \\ \hline Return on Equity (ROE) & 0.74 & 0.74 & 0.00 & Return on Equity (ROE) & -0.21 & -0.30 & 0.00 \\ \hline Return on Invested Capital (ROIC) & 0.27 & 0.15 & 0.00 & Return on Invested Capital (ROIC) & 0.48 & 0.50 & 0.00 \\ \hline Interest Coverage & 60.11 & 54.10 & 0.00 & Interest Coverage & 21.11 & 14.90 & 0.00 \\ \hline \end{tabular}
Step by Step Solution
There are 3 Steps involved in it

Get step-by-step solutions from verified subject matter experts