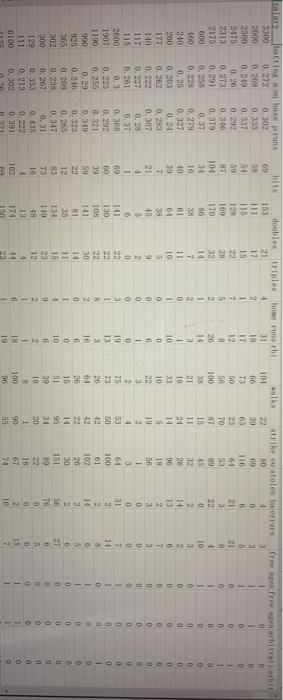
Question: baseball salary data is like this kind. it's too long, but you can find it on internet easily Problem 4. Use the 'Baseball Salary Data'

baseball salary data is like this kind. it's too
baseball salary data is like this kind. it's too long, but you can find it on internet easily
baseball salary data is like this kind. it's too
Problem 4. Use the 'Baseball Salary Data' again (and with salary as the response) to do the following: (a) Use the command 'leaps' in the R package "leaps" along with the strategy discussed in class to choose a good subset of the 16 predictors to include in a linear model with "salary" as the response (and not its logarithm). Describe fully the rationale you use in choosing your model. (Note: A help file on the "leaps" package, as well as the R function 'leaps. AIC' (used to compute the AIC and BIC values for the best subset models of each size returned by leaps'), are available under R Codes and Instructions in eCampus. Feel free to use these resources for part (a) above.) (b) Plot the standardized residuals from your chosen model (in part (a) above) versus an index running from 1 to 337. Identify any players who have standardized residuals that are larger in absolute value than 3. Are these players different in any important way from most of the other players? (c) Provide a plot of the standardized residuals versus the predicted values and comment on the plot. (d) Provide a Normal probability (or Q-Q) plot of the standardized residuals and comment on the plot. (e) Provide a plot of Cook's D values. Do any data points seem to be influential? Why or why not? triples doubles 163 home runs hi hits 69 58 walks 104 strike ou stolen betror free acon free acen arbitratarbit 59 - - alatyhatting won base pruns 3300 0 272 0.302 2600 0.200 0,335 2500 0.249 0.337 2475 0.26 0,292 0.273 0.316 2175 0.291 0.379 600 0.258 0.37 460 0.228 0.279 240 0.250.327 200 0.203 0.24 177 0.262 0.283 140 0.222 0,307 0.227 0.28 115 0.261 0.37 2600 0.3 0.368 1907 0.225 0.292 1190 0.255 0.321 0.29 0.319 925 0.246 0.323 365 0.208 0.265 302 0.238 0.347 0.267 0.31 129 0.353 0.435 111 0.213 0.222 6100 0.302 0.391 - 990 no non 300 - Problem 4. Use the 'Baseball Salary Data' again (and with salary as the response) to do the following: (a) Use the command 'leaps' in the R package "leaps" along with the strategy discussed in class to choose a good subset of the 16 predictors to include in a linear model with "salary" as the response (and not its logarithm). Describe fully the rationale you use in choosing your model. (Note: A help file on the "leaps" package, as well as the R function 'leaps. AIC' (used to compute the AIC and BIC values for the best subset models of each size returned by leaps'), are available under R Codes and Instructions in eCampus. Feel free to use these resources for part (a) above.) (b) Plot the standardized residuals from your chosen model (in part (a) above) versus an index running from 1 to 337. Identify any players who have standardized residuals that are larger in absolute value than 3. Are these players different in any important way from most of the other players? (c) Provide a plot of the standardized residuals versus the predicted values and comment on the plot. (d) Provide a Normal probability (or Q-Q) plot of the standardized residuals and comment on the plot. (e) Provide a plot of Cook's D values. Do any data points seem to be influential? Why or why not? triples doubles 163 home runs hi hits 69 58 walks 104 strike ou stolen betror free acon free acen arbitratarbit 59 - - alatyhatting won base pruns 3300 0 272 0.302 2600 0.200 0,335 2500 0.249 0.337 2475 0.26 0,292 0.273 0.316 2175 0.291 0.379 600 0.258 0.37 460 0.228 0.279 240 0.250.327 200 0.203 0.24 177 0.262 0.283 140 0.222 0,307 0.227 0.28 115 0.261 0.37 2600 0.3 0.368 1907 0.225 0.292 1190 0.255 0.321 0.29 0.319 925 0.246 0.323 365 0.208 0.265 302 0.238 0.347 0.267 0.31 129 0.353 0.435 111 0.213 0.222 6100 0.302 0.391 - 990 no non 300

Step by Step Solution

There are 3 Steps involved in it

1 Expert Approved Answer
Step: 1 Unlock blur-text-image
Question Has Been Solved by an Expert!

Get step-by-step solutions from verified subject matter experts

Step: 2 Unlock
Step: 3 Unlock

Students Have Also Explored These Related General Management Questions!