

Question: based off these two charts which statements are true : The quantity at which breakeven occurs is found where TR - TC = 0. The
based off these two charts which statements are true : The quantity at which breakeven occurs is found where TR - TC = 0. The quantity of participants/bags that maximizes profits is found where MR MC 300. The quantity of participants/bags that maximizes profit is found where MR MC 400. Using Qb = F/(MR - AVC) the estimated breakeven quantity of participants/bags in approximately between 113 and 115.
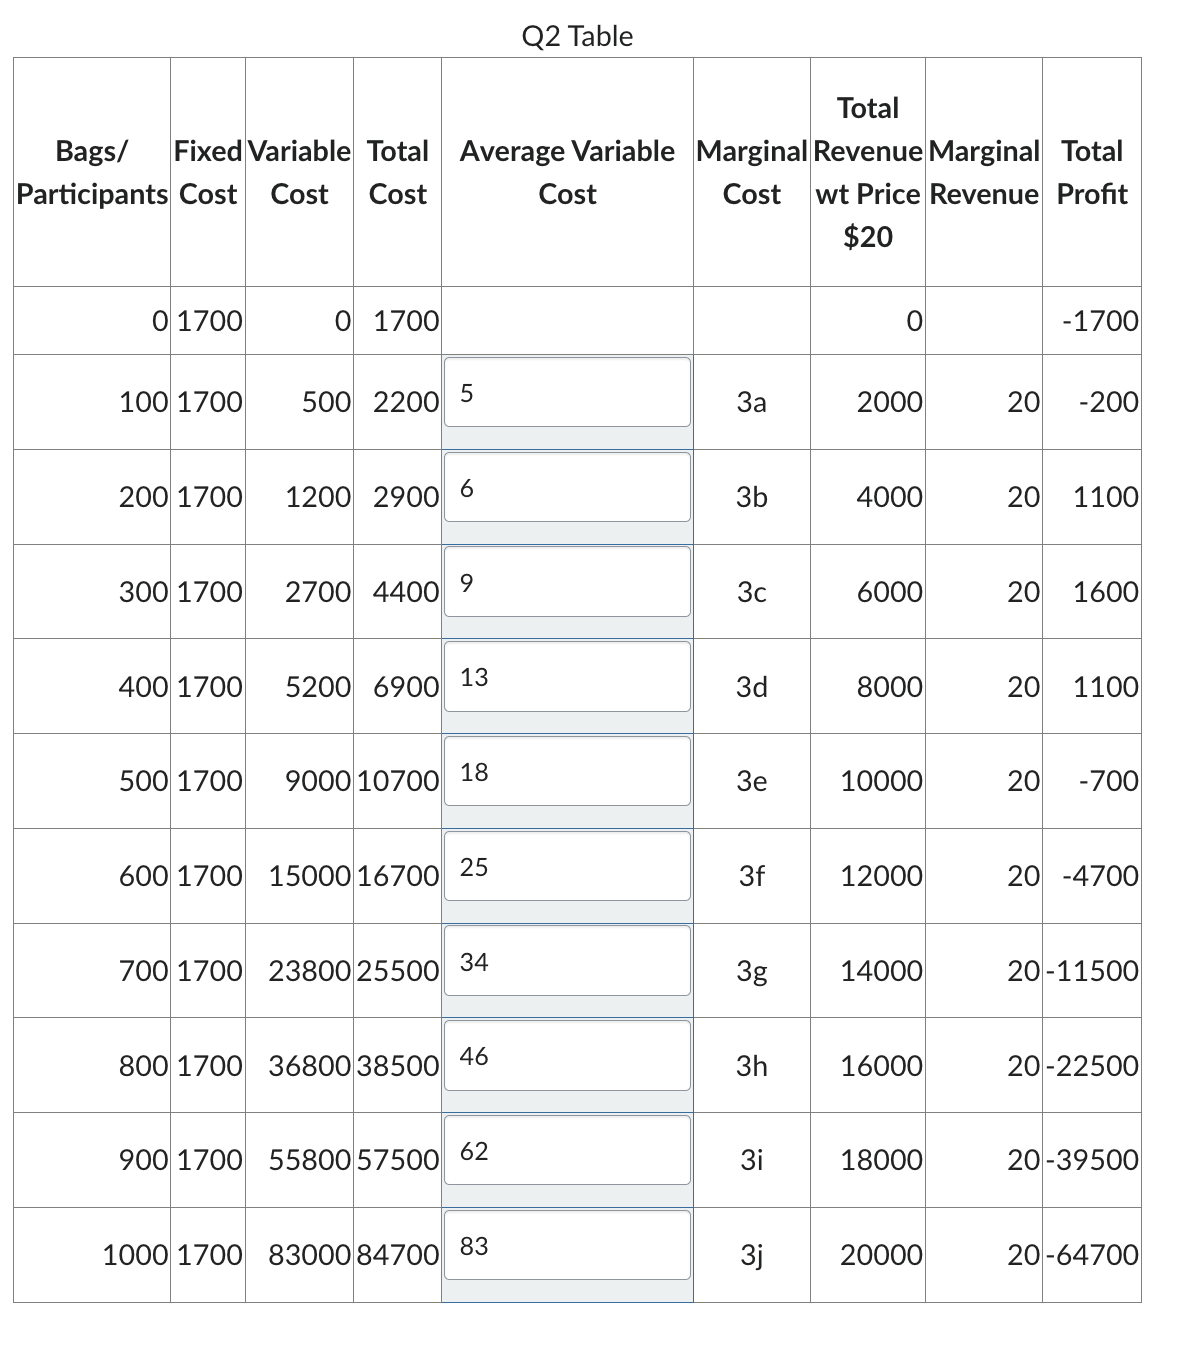 Q2 Table 84700 Bags/ Fixed Variable Total | Average Variable Marginal Revenue Marginal) Total Participants} Cost) Cost | Cost Cost Cost /|wt Price Revenue) Profit $20 0| 1700 0 1700 0 -1700 100) 1700 500 2200 3a 2000 20) -200 2001700) 1200 2900 6 3b 4000 20) 1100 300.1700) 2700 4400 7 3c 6000 20) 1600 400.1700 5200) 6900) 13 3d 8000 20) 1100 5001700 9000 10700 18 3e 10000 20) -700 6001700) 15000 16700 25 Sf 12000 20) -4700 7001700) 23800 25500 34 3g 14000 20|-11500 8001700) 36800 38500 46 3h 16000 20|-22500 9001700) 55800 57500 62 3i 18000 20|-39500 1000/1700) 83000 | 83 3} 20000 20|-64700
Step by Step Solution
There are 3 Steps involved in it
1 Expert Approved Answer
Step: 1 Unlock

Question Has Been Solved by an Expert!
Get step-by-step solutions from verified subject matter experts
Step: 2 Unlock
Step: 3 Unlock