

Question: Based on Bridge Design Project Learning Activity # 2 . Create an Excel table and properly labeled graph for a data set. This question and
Based on Bridge Design Project Learning Activity #
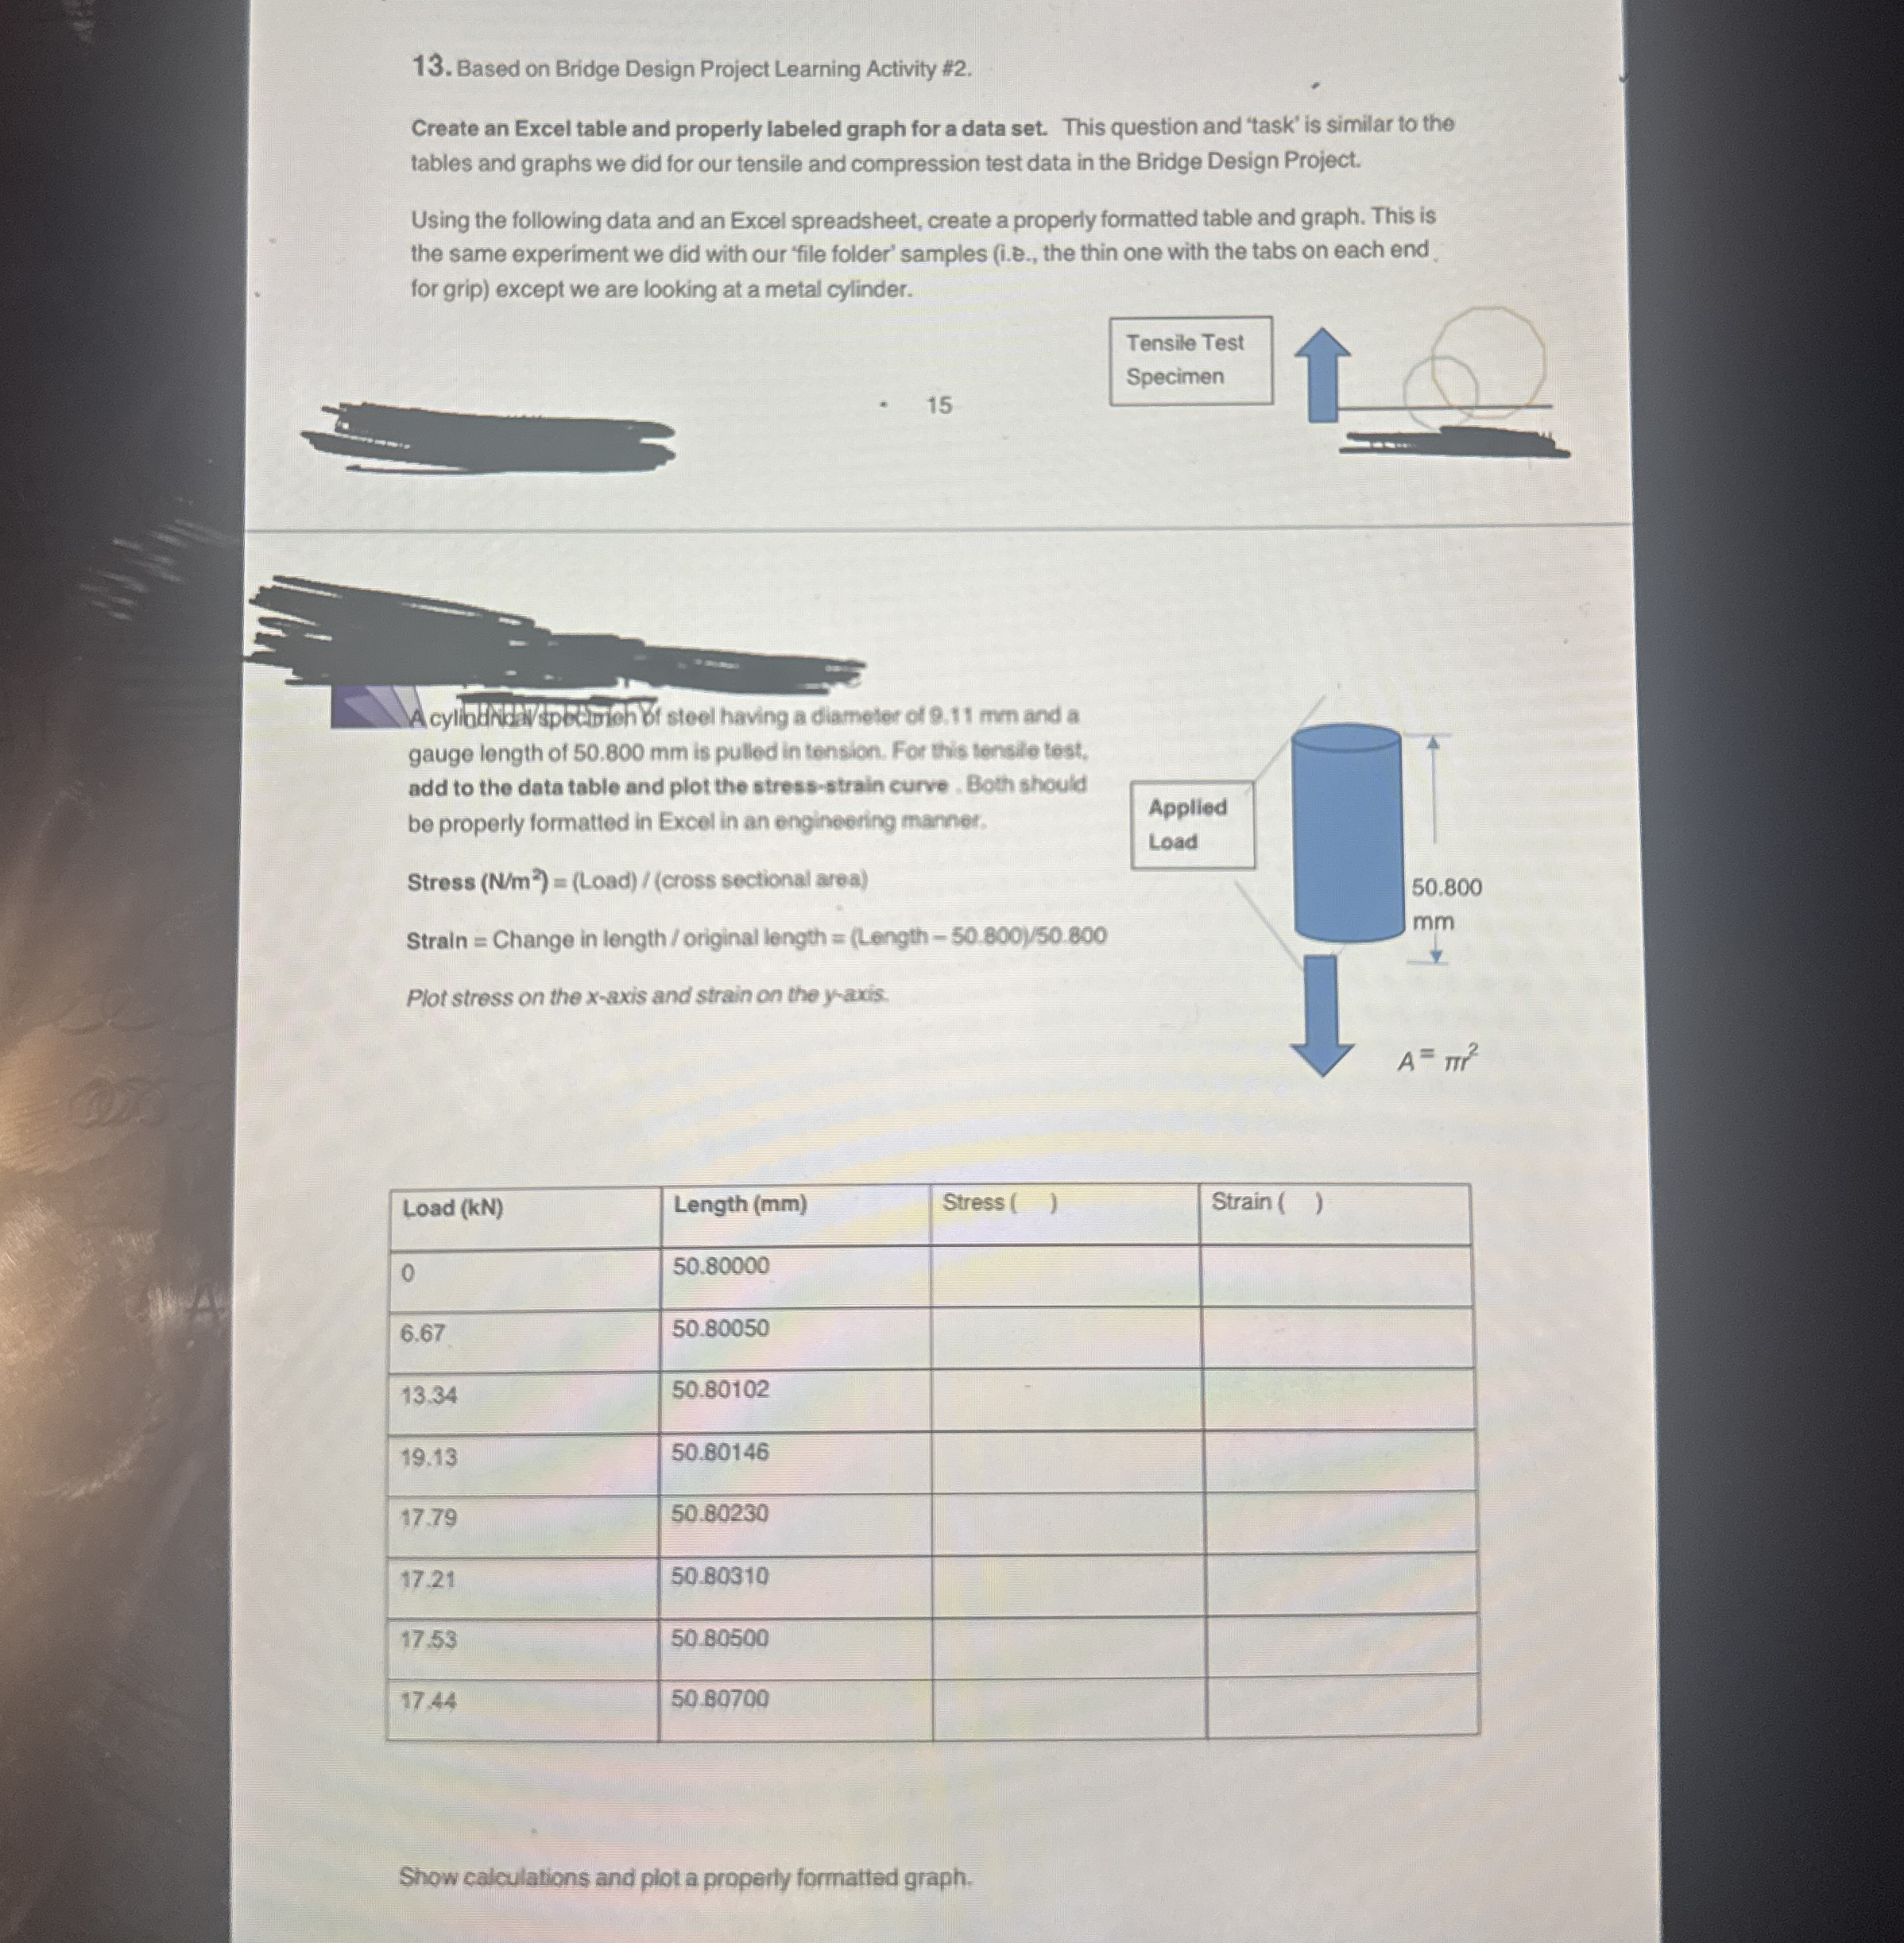
Create an Excel table and properly labeled graph for a data set. This question and 'task' is similar to the tables and graphs we did for our tensile and compression test data in the Bridge Design Project.
Using the following data and an Excel spreadsheet, create a properiy formatted table and graph. This is the same experiment we did with our 'file folder' samples ie the thin one with the tabs on each end. for grip except we are looking at a metal cylinder.
Acylibandivspetimonti steel having a diameter of mm and a gauge length of mm is pulled in tension. For this tensile test, add to the data table and plot the stressstrain curve. Both should be properly formatted in Excel in an engineering manner.
Stress Load
Step by Step Solution
There are 3 Steps involved in it
1 Expert Approved Answer
Step: 1 Unlock

Question Has Been Solved by an Expert!
Get step-by-step solutions from verified subject matter experts
Step: 2 Unlock
Step: 3 Unlock