

Question: Based on data presented in Table 2 below, calculate the relative risk for the association of tight control (versus less tight control) and neonatal death.
Based on data presented in Table 2 below, calculate the relative risk for the association of tight control (versus less tight control) and neonatal death. Please show all calculations...
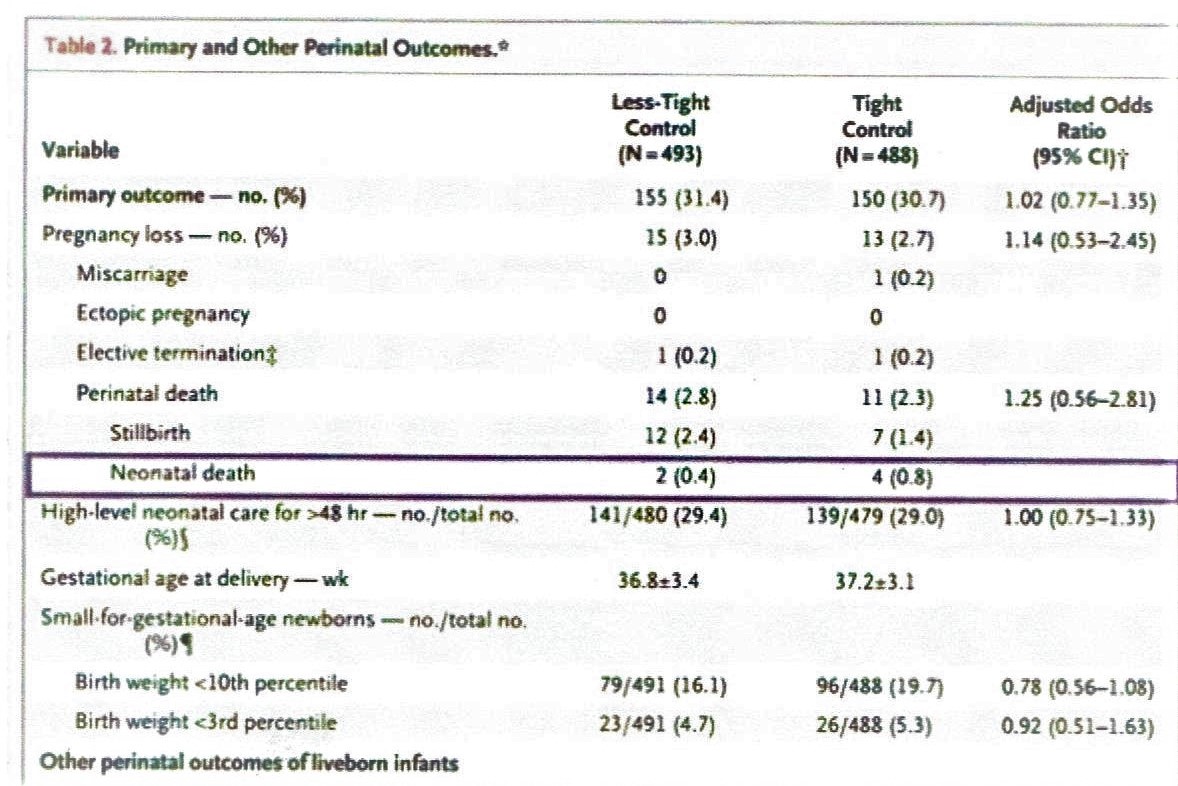
Table 2. Primary and Other Perinatal Outcomes .* Less - Tight Tight Adjusted Odds Control Control Ratio Variable IN = $93 ) [ N = $ 88) 195%6 CH17 Primary outcome - 170 . ( 9/6 ) 155 ( 31. 4) 150 ( 30.7) 1.02 ( 0. 71 - 1.35) Pregnancy loss - no . (95 ) 15 ( 3.01 13 (2. 7 ) 1. 14 10.53- 2. 45 ) Miscarriage 1 10.2) Ectopic pregnancy O O Elective terminations 1 1 0. 2) 1 10.2) Perinatal death 14 ( 2.8 ) 11 (2.3 ) 1.25 ( 0.56 - 2.81 ) Stillbirth 12 ( 2. 4 ) 7 ( 1. 4 ) Neonatal death 2 10. 4) 4 10.81 High- level neonatal care for = AS hir -_ no. / total no. 141 / 480 (29. 4) 139/ 479 (29. 01 1.00 10.75- 1.33) 13615 Gestational age at delivery - wk 36.8 + 3.4 37.2 + 3. 1 Small . for- gestational- age newborns - no. / total no` $ 196 ) Birth weight cloth percentile* 79 / 491 ( 16.1) 96 / 488 (19. 7) 0. 78 1 0.56 - 1.08 ) Birth weight
Step by Step Solution
There are 3 Steps involved in it

Get step-by-step solutions from verified subject matter experts