Question: Based on information discussed in the PowerPoint entitled The Changing Health Care Environment: Changed Healthcare Economics The New Business Models, show your understanding of
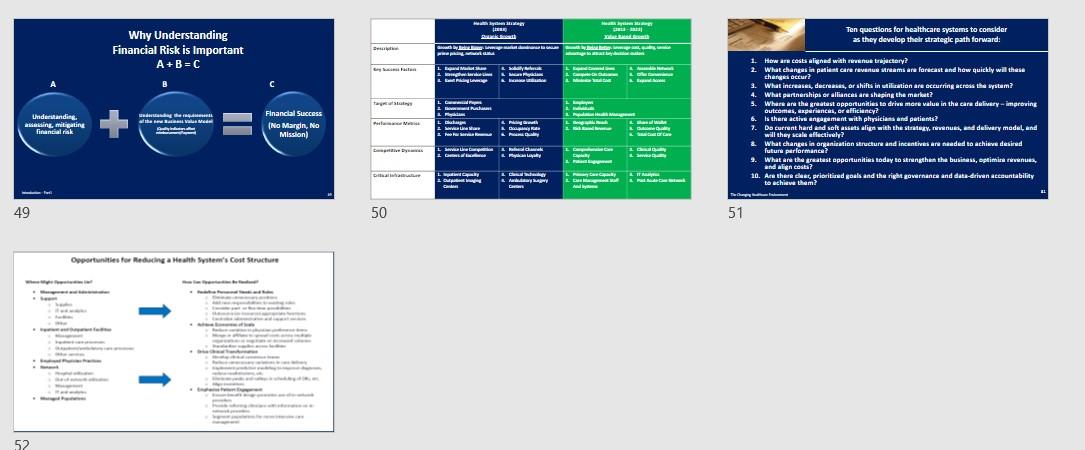
Based on information discussed in the PowerPoint entitled " The Changing Health Care Environment: Changed Healthcare Economics The New Business Models," show your understanding of the following: The shift from traditional hospital growth (Price Extractive Growth) strategies to the new business model.
Include a discussion of Key Success Factors, Target of Strategy, Performance Metrics, Competitive Dynamics, and Critical Infrastructure
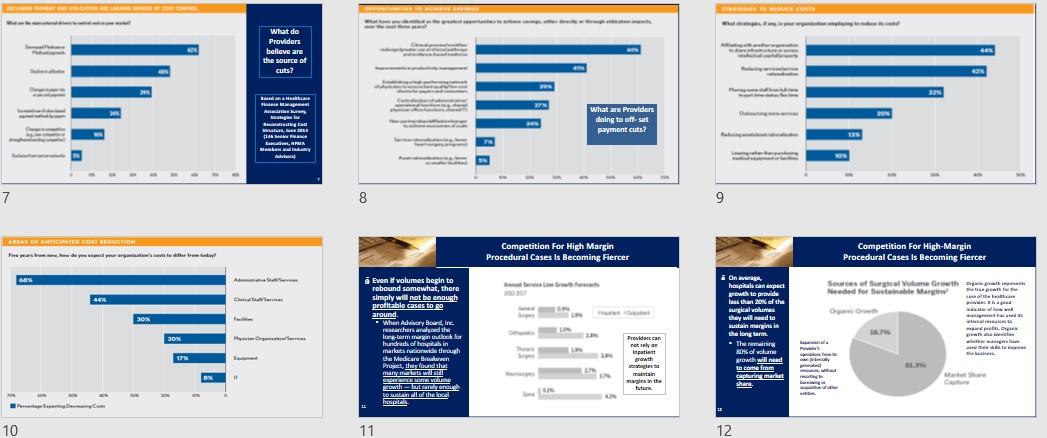
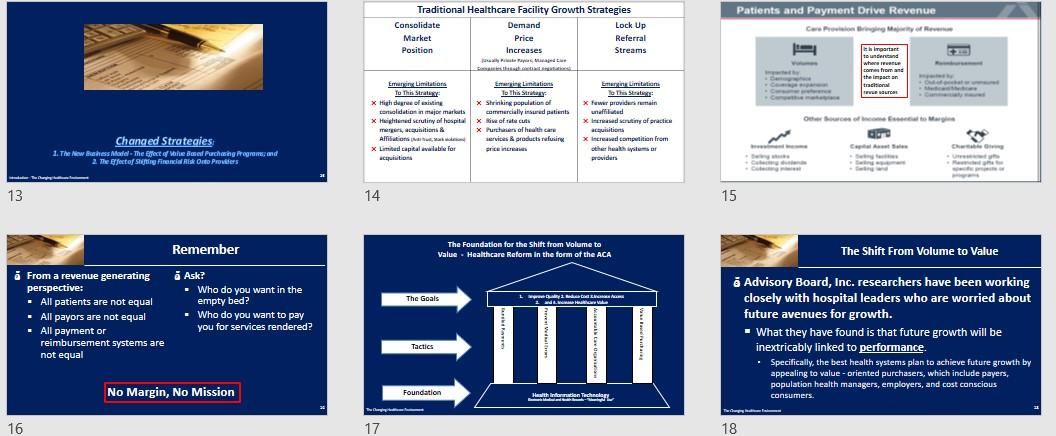
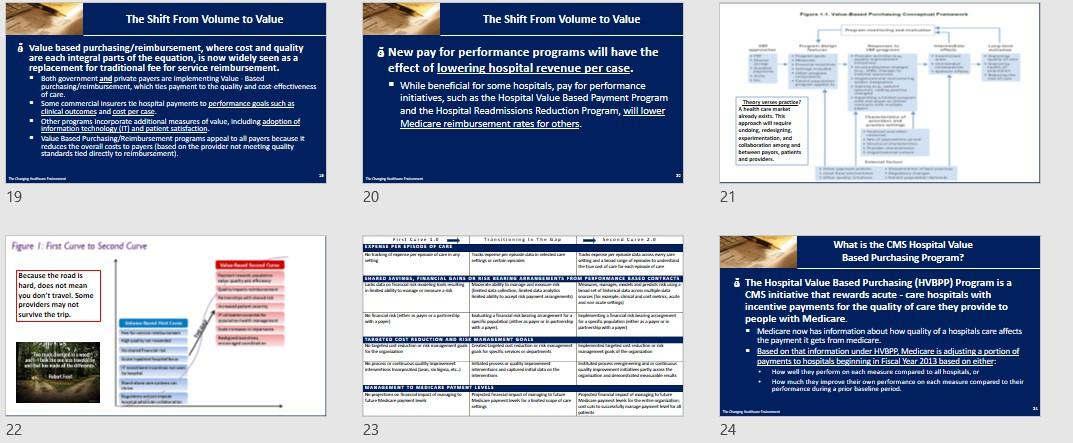
The Healthcare Industry is Facing an Onslaught of Rate Cuts Financial Risks Health Care Providers Face Every health care provider knows the pressures on the financial bottom line are already intense and growing stronger. Health care providers today are facin Raducedurement Price cuts Em Demographic shifts Volume showfalls Rupdatory merol culty lied to rement Media scrutiny of charger Changing market demand Competition from non-tradition providers Technologie advances implementation of vectronic medical cerchi Nu options for providing care All of the above may affect the bottom. Mne Traditional growth strategies w.no longer work i Athenat decade, Roupitali alone will bort sur $460 billion in rat cuts from the Affordable Care Act (ACAL That wil been one pa farhaith can provident there will be war and fewer connect inundata who could potentially attest offunt the Medicare Cute The Changing Health Care Environment: The New Business Model 1 2 2 3 Medicare to Become Majority of Volume by 2022 Medicare FFS Payment Cuts Continue RES MEDICARE MARGINS DRIVEN TO ALL TIME LOW Medicare Beneficiaries in Man 62 2013 2014 2015 2016 2017 SUR 2018 2020 2021 20122 60 $146 58 BA As the Baby Boomers age. Medicare will account for a larger share of hospitals' payer mtx each year Hinbat Petar marca, 2013-2022 10 56 60.7 CSA (272 59 FA 54 57.3 55.6 52 54 $260B H $568 $151B SO 2014 2020 2018 2016 2018 Medarbecedare HOSPITAL, OVERALL MEDICARE MARGINS 4 5 6 What do Providers believe are the source of cuts? GEN CON Heaithu thuna Aulades www MER, 14 Bre, A Maalan Advi What are providers doing to offset payment cuts? 33 7 8 9 AREAS DE ANTICIPATE CONTRO Firews.deyerlisteddy Competition for High Margin Procedural Cases Is Becoming Fiercer Competition For High-Margin Procedural Cases Is Becoming Fiercer AS Sources of globe Growth Needed for Sustainable Marine The 44 C SON i On average hospitals can expect growth to provide less than 20 of the Surgical volumes they will read to suitainginis ha long term. - The Sukowane growth will need to come from capturin marat ther ww www. pre news www th 20N Even if volumes begin to rebound somewhat, there simply will not be enough profitable cases to around. - When Advisory Board, Inc. researchers and the long-term win outlook for hundreck of spitalin markusowe though the Medicare treburen Prod, they found that Who Louitandoftheca hespite POS 21 LA 17 Providers can not rely on Inpatient prowth traplesse ## maintain in the tature) Many led De Cum 1: 10 11 12 Patients and Payment Drive Revenue Traditional Healthcare Facility Growth Strategies Consolidate Demand Lock Up Market Price Referral Position Increases Streams Jaya the important to understand whore Com the impact on tradition Emery Limitations Emerging Linations To This Strategy To this Strategy X High degree of citing x Shrinking population of teriolidation in major markets commercially insured parts x Highland scrutiny al hospital X Rise of rate cuts itiamas X Purch of healthcare Affiliations services product refusing X Limited capital awlab for price incre acquisition Enteng Limitetin The State x fuwe providers unaffiliated Xird scrutiny of praction - tiar x increased competition from other the providers Gled IN Changed Strategies 1. The world - The Effect of the Based Purchasing Programs and The Effectos Swing Financial Risk Ondo Profes . 13 14 15 Remember The Foundation for the Shift from Volume to Value - Healthcare Reform in the form of the ACA The Shift From Volume to Value L. The Goals cm. From a revenue generating perspective: All patients are not equal All payors are not equal All payment or reimbursement systems are not equal Ask? Who do you want in the empty bed? Who do you want to pay you for services rendered? & Advisory Board, Inc. researchers have been working closely with hospital leaders who are worried about future avenues for growth. What they have found is that future growth will be inextricably linked to performance. Specifically, the best health systems plan to achieve future growth by appealing to value-oriented purchasers, which include payers, population health managers, employers, and cost conscious Tactics No Margin, No Mission Foundation Health Internecie -- consumers. 16 17 18 The Shift From Volume to Value The Shift From Volume to Value value based purchasing/reimbursement, where cost and quality are each integral parts of the equation, is now widely seen as a replacement for traditional fee for service reimbursement. Both government and private payers are implementing Value Based purchasing/reimbursement, which ties payment to the quality and cost effectiveness of care. Some commercial insurers tie hospital payments to performance goals such as clinical outcomes and cost per case Other programs incorporate additional measures of value, including adoption of information technology (IT) and patient satisfaction. Value Bazed Purchasing/Reimbursement programs appeal to al payers because reduces the overall costs to payers (based on the provider not meeting quality standards tied directly to reimbursement). New pay for performance programs will have the effect of lowering hospital revenue per case. While beneficial for some hospitals, pay for performance initiatives, such as the Hospital Value Based Payment Program and the Hospital Readmissions Reduction Program, will lower Medicare reimbursement rates for others. There? Atal market already adats. The approach wie ending redning part, and collaboration among and and bet payer and provides Nature 19 20 21 Figure 1 First Curve to Second Cune What is the CMS Hospital Value Based Purchasing Program? www.Boom PIRE CHE TSISIR TRUP B. EXPERI PIKIPINDBE OP CARI . - SHARED SAVIVA, CINCIAL BAIRR GRRIER BLANTE ARRATIBERTA FROM PREPORMANCE KRUD CONTACT TAP Sand Because the road is hard, does not mean you don't travel. Some providers may not survive the trip - tie www. TIBITED CONTRIBUCTION AND RIER ARASIMENT GOAL TARGETED The Hospital Value Based Purchasing (HVBPP) Program is a CMS initiative that rewards acute - care hospitals with incentive payments for the quality of care they provide to people with Medicare. Medicare now has information about how quality of a hospitals care affects the payment it gets from medicare. - Based on that information under HVBPP, Medicare is adjusting a portion of payments to hospitals beginning in Fiscal Year 2013 based on either , How will they perform on each meine compared to all hospitals, or How much they improve their own performace on each mare compared to their performance during a prier baseline period. TO ALE wwwafa Rube www . www. WARABINERT TO WEAR PATEST LIVES . waar www.thew They 22 23 24 The Efficiency Score A facility's score (the incentive or penalty payments) depends on ... 2014 - Clinical Press The ACA and Hospital Value Based Purchasing . Through the program, CMS calculates an incentive payment for each hospital 2015 relative to a "withhold." Medicare - Meaning a certain percentage of inpatient payments are withheld from each hospital Hospital 1,714 to fund the program Payments Hospitals can then receive a penalty or a Boosted bonus under VBP Medicare - If a hospital does well on Ver, it can cam back more than the withhold, effectively Hintpitat 1425 caring a bonus overall Payments Perform poorly and the reverse true Docked 1,251 Patient Exp Safety w ceny w Outcome Patient Experience of Care w clinical Process of Care As stated Medicare's HVBPP program includes an Efficiency Score to determine whether a facility receives Incentive payments. This marks the first time that the CMS has included straight financial measure in Its VEP calculation The Efficiency Score Introduces a new acronym Medicare Spending Per Beneficiary (MSPB). - The measure shows whether medicare spend morc, less or about the same per medicare patient treated in a specific hospital, compared to how much medicare spends per patient nationally - The measure includes part A and part B payments. 30% Outcom 1,400 20 May . Equal - Teal Dec Paste Scare FY 2011 FY 2014 FY 2015 FY 2016 FY 2017 25 26 27 Interpreting The Efficiency Score The Efficiency Report Spending Per Hospital Patient with Medicare (displayed as a ratio) Calculating the Score: Medicare Spending Per Beneficiary The MSPB measure covers a hospital's spending per Medicare patient for eligible patient care episodes, starting three days before an inpatient hospital admission and ending 30 days after discharge . It is also the first instance in which hospitals are directly accountable for non- acute care costs accrued by non affiliated physicians and post acute providers. - Each hospital's baseline MSPB, which reflects its performance for the period from May 1, 2011 to December 31, 2011, is currently posted on Medicare's Hospital Compare website. The score is determined by dividing the hospital's MSBP by the median amount per Medicare beneficiary that CMS spends nationally A score of 1 indicates that the hospital meets the average efficiency of all hospitals nationally. Below 1 indicates that the hospital is more efficient than the U.S. average. 8 Above means the hospital more costly than the US average Brooklyn Hopital Center Ratio 0.95 Each hospital has access to an Efficiency Report. - The Report breaks down spending in each phase by daim type + culpatient skilled muring + durable medical equipment, and Others - toalow far comparison with us and national ragas The report also identifies a hospital's average spending per episode by major diagnostic category and compares that amount to state and national averages (see the exhibit below). Thus, health care professionals can see, for example, if a hospital has relatively high costs for nervous system issues or low costs for mental disorders. Balleris Hari Cantar Ratio 0.93 we candy al portalen New York Average is 0.94 National Average is 0.98 28 29 30 C ERY NH SAMPLE HOSPITAL EFFICIENCY REPORT Wall 1.00 ---- hina Hutcnha w SIME Ha KHN SIA com all M CH Cri LINE Malle Interactive Databases for all hospitals found at http://www.kai serhealthnews. org/Stories/201 2/May/07/Med icare-efficiency by-hospital- chart.aspx Sew Curly Hall NE 1 NIN M Carey MIK N. IN . 3 . SIRTIN M th Les og ca Lega de HE um SI 31 32 33 w Zeroing in on Efficiency Zeroing in on Efficiency Me 1 . NYB Ten | Mw Saraw SET HO Now E ESTAW . S. STAR Saw . Like all measures in the government's VBP initiative, CMS's way of measuring efficiency is likely to evolve over time. . The American Hospital Association (AHA) recently offered comments on a proposed efficiency measure specifically for a heart attack episode of care. Nancy Foster, AHA's Vice President for Quality and Patient Safety Policy says many hospital executives would prefer to have cost accountability for particular diseases or conditions, rather than an entire diagnostic group or all Medicare patients. . Meanwhile, Chad Mulvany, HEMA Technical Director, believes CMS's approach to measuring efficiency will be flawed until all caregivers across the continuum share accountability. "Until you align the incentives for physicians and also for post acute care providers to focus on the cost efficiency of care delivery, then I don't think it's an appropriate measure," he says. M. SETS S. Saw . . SE LAI . Mine Tullnetan H . Bade Maari MOS M. Balla EU S. Hop They 34 35 36 Year Net Loss/Gain Annual Medicare ve for a Facility Ince Payment HHS' Goal Is That By 2016 Medicare FFS Physician Feedback Program/Value-Based Payment Modifier Sample VBP Incentive Payment Calculation Kol DAG Dollar of VP Payment Amount Incentive Withild Withild Payment Automatically Automatically Er 1.00% $500,000 BU 2013 $15.000.000 SADU DOO $100,000 2014 $15.000.000 $625.000 BU% $500 DOO $125,000 HHS' goal is that by 2016, 85% of Medicare's payments to providers will be under the value based purchasing model, rather than fee-for- service. The shift to value based purchasing from fee-for-service has been ongoing, but the pressure is on for providers and healthcare systems who have been lagging behind in embracing alternative payment models. The Physician Feedback Program provides comparative performance information to physicians and medical practice groups, as part of Medicare's efforts to improve the quality and efficiency of medical care furnished to Medicare beneficiaries. CMS states that providing clinically meaningful and actionable information to physicians so they can improve the care they deliver, contributes to the building of a health care system that delivers better care, spends health care dollars more wisely and results in healthier people." 2015 $15.000.000 1.50% S780.000 BUX SO 5-150 DIN 2016 $15.00LOGO 1.5% SEM. BUX STUDOU 3175.000 20137 $15.000.000 $ 2.0% $1.000.000 BUX SOL.000 $ 200,00 Facilities warta pot hack what was withold play an incentive payment, ua thay da nos esperience a los be 37 38 39 Medicare FFS Physician Feedback Program/Value-Based Payment Modifier The Value Modifier Program Quality Domains and Quality Tiering Methodology CMS wil domains to combine each quality mature into a quality composite and each cost mesure into a cost composites outlined in the diagram below Per ngta Camp Pasay Care Coordinate The Program (which is a The Physician Value Based Modifier, which specific to Fee-For-Service includes an Efficiency Score, will go into Medicare not Medicare Advantage) effect for large physician groups in 2015 and contains two primary expand to all physicians two years later. components: - The Value Modifier is an adjustment made 1. Quality and force the parts UR) on a per claim basis to Medicare payments 2. Drapment and for items and services under the Medicare implementation of the Vaba aed Payment PFS. Mua (aka Moc The Value Modifier IVMI program assesses both quality of care furnished and the cost of that care under the Medicare Physician Fee Schedule. - bus CMS phase-in of the VM in 2015 bewed on 2013 reporting for groups of 100+ Elite Professionale - Phase-in wil be completed in 2017 winne VM will be applied o la practitioners and groups of worm EN - Implementation of the VMI based in por participation in Physician Quality Reporting Syams le entonan Son Meporting ht Surfery CON CALL Dies 40 41 42 Shifted Financial Risk . Financial risk is defines as: whomever (patient, provider, third party payor) shoulders the burden of added cost, if the patient requires additional care beyond negotiated rate or reimbursement. Who pays for increased health care utilization? Shifting or spreading financial risk is shifting or spreading the financial burden of utilization of health services by patients from and among the three parties (patient, provider, third party payor). Different payment and/or reimbursement systems create different amounts of financial risk for patient, provider, or third party payer (government entitlement, managed care contract/(HMO). Changed Strategies: Shifted Financial Risk Art 43 44 45 Shifting Financial Risk Payments Incentives and Financial Risks To Providers Low Provider Incentive to Lower the High Provider Incentive to Lower the Number of Care Episodes Number of Care Episodes Preparing for the Burden of Shifting Financial Risk Capitation Fee For Service Lowest Financial Risk Providers Highest Financial Risk . The shift may be the result of: A contract between or among payors parties A A regulatory requirement or negotiated contract (ACOs; Bundled Care) A choice by the patient, as part of overall benefit plan. The most common means used by Third party payers to shift or spread financial risk to providers are: Capitation managed care producers) Withholding (retaining a percentage of payment due to reward or punish use trends at year end Discounted fees for services provider required to give a discount to the third party payer on amounts due) Per diem payments flat for per day per patient and Profit sharing (ACD, Bundled Payments, Shared Savings Payers Highest Financial Risk Lowest Financial Risk In order to prepare for the new Health Care Business Value Model the greatest challenge for a healthcare professionals is to identify the various effects of shifting financial risk onto providers that may present at any time in the operations of the healthcare facility-from providing acute care services to long term care-across the healthcare continuum. This requires a knowledge of all financial aspects of the facility, such as Financial Performance Financial Benchmarks Financial Strategic Planning Consumers Risk of Overtreatment Risk of Under Treatment Employers Risk of High Costs From Inefficiency Risk of High Costs From Under Treatment Fee for service equal traditional method of paying provides for each service performed; capitation equal specified dule amount per cord person, viually sted in a monthly amount 47 46 48 My Man www. BELE BER | we Ten questions for healthcare systems to consider as they develop their strategic path forward: Why Understanding Financial Risk is Important A+B=C = Der L BMW da como LD Understanding asing, mitigating financial risk alth Wales Mad Financial Success (No Margin, No Mission) w www Lachang North BOR wines Monday I 1. How are costs aligned with renul treju tery? 2. What changes in patient care revenue streams are forecast and how quickly wil these changes occur? 3. What increases, decreases, or shifts in utilization are occurring across the system? 4. What partnerships or alliances are shaping the marlot? 3. Where are the greatest opportunities to drive more value in the care delivery improving outcomes, experiences, or efficiency? 6. Is there active engagement with physicians and patients? 7. De current hard and solutsalgs with the strategy, news, and delivery model, and will they scale effectively? & What changes in organisation structure and incentives are needed to achieve desired future performance? 9. What are the greatest opportunities today to strengthen the business, optimin nues, and aligncasts? 10. Are there dieet prioritized goals and the right overnance and data-driven accountability to achieve them? Le chama - 2 Makan Dy Ly | LO ITA | My D 49 50 51 Opportunities for Reducing a Health System's Cost Structure 52 The Healthcare Industry is Facing an Onslaught of Rate Cuts Financial Risks Health Care Providers Face Every health care provider knows the pressures on the financial bottom line are already intense and growing stronger. Health care providers today are facin Raducedurement Price cuts Em Demographic shifts Volume showfalls Rupdatory merol culty lied to rement Media scrutiny of charger Changing market demand Competition from non-tradition providers Technologie advances implementation of vectronic medical cerchi Nu options for providing care All of the above may affect the bottom. Mne Traditional growth strategies w.no longer work i Athenat decade, Roupitali alone will bort sur $460 billion in rat cuts from the Affordable Care Act (ACAL That wil been one pa farhaith can provident there will be war and fewer connect inundata who could potentially attest offunt the Medicare Cute The Changing Health Care Environment: The New Business Model 1 2 2 3 Medicare to Become Majority of Volume by 2022 Medicare FFS Payment Cuts Continue RES MEDICARE MARGINS DRIVEN TO ALL TIME LOW Medicare Beneficiaries in Man 62 2013 2014 2015 2016 2017 SUR 2018 2020 2021 20122 60 $146 58 BA As the Baby Boomers age. Medicare will account for a larger share of hospitals' payer mtx each year Hinbat Petar marca, 2013-2022 10 56 60.7 CSA (272 59 FA 54 57.3 55.6 52 54 $260B H $568 $151B SO 2014 2020 2018 2016 2018 Medarbecedare HOSPITAL, OVERALL MEDICARE MARGINS 4 5 6 What do Providers believe are the source of cuts? GEN CON Heaithu thuna Aulades www MER, 14 Bre, A Maalan Advi What are providers doing to offset payment cuts? 33 7 8 9 AREAS DE ANTICIPATE CONTRO Firews.deyerlisteddy Competition for High Margin Procedural Cases Is Becoming Fiercer Competition For High-Margin Procedural Cases Is Becoming Fiercer AS Sources of globe Growth Needed for Sustainable Marine The 44 C SON i On average hospitals can expect growth to provide less than 20 of the Surgical volumes they will read to suitainginis ha long term. - The Sukowane growth will need to come from capturin marat ther ww www. pre news www th 20N Even if volumes begin to rebound somewhat, there simply will not be enough profitable cases to around. - When Advisory Board, Inc. researchers and the long-term win outlook for hundreck of spitalin markusowe though the Medicare treburen Prod, they found that Who Louitandoftheca hespite POS 21 LA 17 Providers can not rely on Inpatient prowth traplesse ## maintain in the tature) Many led De Cum 1: 10 11 12 Patients and Payment Drive Revenue Traditional Healthcare Facility Growth Strategies Consolidate Demand Lock Up Market Price Referral Position Increases Streams Jaya the important to understand whore Com the impact on tradition Emery Limitations Emerging Linations To This Strategy To this Strategy X High degree of citing x Shrinking population of teriolidation in major markets commercially insured parts x Highland scrutiny al hospital X Rise of rate cuts itiamas X Purch of healthcare Affiliations services product refusing X Limited capital awlab for price incre acquisition Enteng Limitetin The State x fuwe providers unaffiliated Xird scrutiny of praction - tiar x increased competition from other the providers Gled IN Changed Strategies 1. The world - The Effect of the Based Purchasing Programs and The Effectos Swing Financial Risk Ondo Profes . 13 14 15 Remember The Foundation for the Shift from Volume to Value - Healthcare Reform in the form of the ACA The Shift From Volume to Value L. The Goals cm. From a revenue generating perspective: All patients are not equal All payors are not equal All payment or reimbursement systems are not equal Ask? Who do you want in the empty bed? Who do you want to pay you for services rendered? & Advisory Board, Inc. researchers have been working closely with hospital leaders who are worried about future avenues for growth. What they have found is that future growth will be inextricably linked to performance. Specifically, the best health systems plan to achieve future growth by appealing to value-oriented purchasers, which include payers, population health managers, employers, and cost conscious Tactics No Margin, No Mission Foundation Health Internecie -- consumers. 16 17 18 The Shift From Volume to Value The Shift From Volume to Value value based purchasing/reimbursement, where cost and quality are each integral parts of the equation, is now widely seen as a replacement for traditional fee for service reimbursement. Both government and private payers are implementing Value Based purchasing/reimbursement, which ties payment to the quality and cost effectiveness of care. Some commercial insurers tie hospital payments to performance goals such as clinical outcomes and cost per case Other programs incorporate additional measures of value, including adoption of information technology (IT) and patient satisfaction. Value Bazed Purchasing/Reimbursement programs appeal to al payers because reduces the overall costs to payers (based on the provider not meeting quality standards tied directly to reimbursement). New pay for performance programs will have the effect of lowering hospital revenue per case. While beneficial for some hospitals, pay for performance initiatives, such as the Hospital Value Based Payment Program and the Hospital Readmissions Reduction Program, will lower Medicare reimbursement rates for others. There? Atal market already adats. The approach wie ending redning part, and collaboration among and and bet payer and provides Nature 19 20 21 Figure 1 First Curve to Second Cune What is the CMS Hospital Value Based Purchasing Program? www.Boom PIRE CHE TSISIR TRUP B. EXPERI PIKIPINDBE OP CARI . - SHARED SAVIVA, CINCIAL BAIRR GRRIER BLANTE ARRATIBERTA FROM PREPORMANCE KRUD CONTACT TAP Sand Because the road is hard, does not mean you don't travel. Some providers may not survive the trip - tie www. TIBITED CONTRIBUCTION AND RIER ARASIMENT GOAL TARGETED The Hospital Value Based Purchasing (HVBPP) Program is a CMS initiative that rewards acute - care hospitals with incentive payments for the quality of care they provide to people with Medicare. Medicare now has information about how quality of a hospitals care affects the payment it gets from medicare. - Based on that information under HVBPP, Medicare is adjusting a portion of payments to hospitals beginning in Fiscal Year 2013 based on either , How will they perform on each meine compared to all hospitals, or How much they improve their own performace on each mare compared to their performance during a prier baseline period. TO ALE wwwafa Rube www . www. WARABINERT TO WEAR PATEST LIVES . waar www.thew They 22 23 24 The Efficiency Score A facility's score (the incentive or penalty payments) depends on ... 2014 - Clinical Press The ACA and Hospital Value Based Purchasing . Through the program, CMS calculates an incentive payment for each hospital 2015 relative to a "withhold." Medicare - Meaning a certain percentage of inpatient payments are withheld from each hospital Hospital 1,714 to fund the program Payments Hospitals can then receive a penalty or a Boosted bonus under VBP Medicare - If a hospital does well on Ver, it can cam back more than the withhold, effectively Hintpitat 1425 caring a bonus overall Payments Perform poorly and the reverse true Docked 1,251 Patient Exp Safety w ceny w Outcome Patient Experience of Care w clinical Process of Care As stated Medicare's HVBPP program includes an Efficiency Score to determine whether a facility receives Incentive payments. This marks the first time that the CMS has included straight financial measure in Its VEP calculation The Efficiency Score Introduces a new acronym Medicare Spending Per Beneficiary (MSPB). - The measure shows whether medicare spend morc, less or about the same per medicare patient treated in a specific hospital, compared to how much medicare spends per patient nationally - The measure includes part A and part B payments. 30% Outcom 1,400 20 May . Equal - Teal Dec Paste Scare FY 2011 FY 2014 FY 2015 FY 2016 FY 2017 25 26 27 Interpreting The Efficiency Score The Efficiency Report Spending Per Hospital Patient with Medicare (displayed as a ratio) Calculating the Score: Medicare Spending Per Beneficiary The MSPB measure covers a hospital's spending per Medicare patient for eligible patient care episodes, starting three days before an inpatient hospital admission and ending 30 days after discharge . It is also the first instance in which hospitals are directly accountable for non- acute care costs accrued by non affiliated physicians and post acute providers. - Each hospital's baseline MSPB, which reflects its performance for the period from May 1, 2011 to December 31, 2011, is currently posted on Medicare's Hospital Compare website. The score is determined by dividing the hospital's MSBP by the median amount per Medicare beneficiary that CMS spends nationally A score of 1 indicates that the hospital meets the average efficiency of all hospitals nationally. Below 1 indicates that the hospital is more efficient than the U.S. average. 8 Above means the hospital more costly than the US average Brooklyn Hopital Center Ratio 0.95 Each hospital has access to an Efficiency Report. - The Report breaks down spending in each phase by daim type + culpatient skilled muring + durable medical equipment, and Others - toalow far comparison with us and national ragas The report also identifies a hospital's average spending per episode by major diagnostic category and compares that amount to state and national averages (see the exhibit below). Thus, health care professionals can see, for example, if a hospital has relatively high costs for nervous system issues or low costs for mental disorders. Balleris Hari Cantar Ratio 0.93 we candy al portalen New York Average is 0.94 National Average is 0.98 28 29 30 C ERY NH SAMPLE HOSPITAL EFFICIENCY REPORT Wall 1.00 ---- hina Hutcnha w SIME Ha KHN SIA com all M CH Cri LINE Malle Interactive Databases for all hospitals found at http://www.kai serhealthnews. org/Stories/201 2/May/07/Med icare-efficiency by-hospital- chart.aspx Sew Curly Hall NE 1 NIN M Carey MIK N. IN . 3 . SIRTIN M th Les og ca Lega de HE um SI 31 32 33 w Zeroing in on Efficiency Zeroing in on Efficiency Me 1 . NYB Ten | Mw Saraw SET HO Now E ESTAW . S. STAR Saw . Like all measures in the government's VBP initiative, CMS's way of measuring efficiency is likely to evolve over time. . The American Hospital Association (AHA) recently offered comments on a proposed efficiency measure specifically for a heart attack episode of care. Nancy Foster, AHA's Vice President for Quality and Patient Safety Policy says many hospital executives would prefer to have cost accountability for particular diseases or conditions, rather than an entire diagnostic group or all Medicare patients. . Meanwhile, Chad Mulvany, HEMA Technical Director, believes CMS's approach to measuring efficiency will be flawed until all caregivers across the continuum share accountability. "Until you align the incentives for physicians and also for post acute care providers to focus on the cost efficiency of care delivery, then I don't think it's an appropriate measure," he says. M. SETS S. Saw . . SE LAI . Mine Tullnetan H . Bade Maari MOS M. Balla EU S. Hop They 34 35 36 Year Net Loss/Gain Annual Medicare ve for a Facility Ince Payment HHS' Goal Is That By 2016 Medicare FFS Physician Feedback Program/Value-Based Payment Modifier Sample VBP Incentive Payment Calculation Kol DAG Dollar of VP Payment Amount Incentive Withild Withild Payment Automatically Automatically Er 1.00% $500,000 BU 2013 $15.000.000 SADU DOO $100,000 2014 $15.000.000 $625.000 BU% $500 DOO $125,000 HHS' goal is that by 2016, 85% of Medicare's payments to providers will be under the value based purchasing model, rather than fee-for- service. The shift to value based purchasing from fee-for-service has been ongoing, but the pressure is on for providers and healthcare systems who have been lagging behind in embracing alternative payment models. The Physician Feedback Program provides comparative performance information to physicians and medical practice groups, as part of Medicare's efforts to improve the quality and efficiency of medical care furnished to Medicare beneficiaries. CMS states that providing clinically meaningful and actionable information to physicians so they can improve the care they deliver, contributes to the building of a health care system that delivers better care, spends health care dollars more wisely and results in healthier people." 2015 $15.000.000 1.50% S780.000 BUX SO 5-150 DIN 2016 $15.00LOGO 1.5% SEM. BUX STUDOU 3175.000 20137 $15.000.000 $ 2.0% $1.000.000 BUX SOL.000 $ 200,00 Facilities warta pot hack what was withold play an incentive payment, ua thay da nos esperience a los be 37 38 39 Medicare FFS Physician Feedback Program/Value-Based Payment Modifier The Value Modifier Program Quality Domains and Quality Tiering Methodology CMS wil domains to combine each quality mature into a quality composite and each cost mesure into a cost composites outlined in the diagram below Per ngta Camp Pasay Care Coordinate The Program (which is a The Physician Value Based Modifier, which specific to Fee-For-Service includes an Efficiency Score, will go into Medicare not Medicare Advantage) effect for large physician groups in 2015 and contains two primary expand to all physicians two years later. components: - The Value Modifier is an adjustment made 1. Quality and force the parts UR) on a per claim basis to Medicare payments 2. Drapment and for items and services under the Medicare implementation of the Vaba aed Payment PFS. Mua (aka Moc The Value Modifier IVMI program assesses both quality of care furnished and the cost of that care under the Medicare Physician Fee Schedule. - bus CMS phase-in of the VM in 2015 bewed on 2013 reporting for groups of 100+ Elite Professionale - Phase-in wil be completed in 2017 winne VM will be applied o la practitioners and groups of worm EN - Implementation of the VMI based in por participation in Physician Quality Reporting Syams le entonan Son Meporting ht Surfery CON CALL Dies 40 41 42 Shifted Financial Risk . Financial risk is defines as: whomever (patient, provider, third party payor) shoulders the burden of added cost, if the patient requires additional care beyond negotiated rate or reimbursement. Who pays for increased health care utilization? Shifting or spreading financial risk is shifting or spreading the financial burden of utilization of health services by patients from and among the three parties (patient, provider, third party payor). Different payment and/or reimbursement systems create different amounts of financial risk for patient, provider, or third party payer (government entitlement, managed care contract/(HMO). Changed Strategies: Shifted Financial Risk Art 43 44 45 Shifting Financial Risk Payments Incentives and Financial Risks To Providers Low Provider Incentive to Lower the High Provider Incentive to Lower the Number of Care Episodes Number of Care Episodes Preparing for the Burden of Shifting Financial Risk Capitation Fee For Service Lowest Financial Risk Providers Highest Financial Risk . The shift may be the result of: A contract between or among payors parties A A regulatory requirement or negotiated contract (ACOs; Bundled Care) A choice by the patient, as part of overall benefit plan. The most common means used by Third party payers to shift or spread financial risk to providers are: Capitation managed care producers) Withholding (retaining a percentage of payment due to reward or punish use trends at year end Discounted fees for services provider required to give a discount to the third party payer on amounts due) Per diem payments flat for per day per patient and Profit sharing (ACD, Bundled Payments, Shared Savings Payers Highest Financial Risk Lowest Financial Risk In order to prepare for the new Health Care Business Value Model the greatest challenge for a healthcare professionals is to identify the various effects of shifting financial risk onto providers that may present at any time in the operations of the healthcare facility-from providing acute care services to long term care-across the healthcare continuum. This requires a knowledge of all financial aspects of the facility, such as Financial Performance Financial Benchmarks Financial Strategic Planning Consumers Risk of Overtreatment Risk of Under Treatment Employers Risk of High Costs From Inefficiency Risk of High Costs From Under Treatment Fee for service equal traditional method of paying provides for each service performed; capitation equal specified dule amount per cord person, viually sted in a monthly amount 47 46 48 My Man www. BELE BER | we Ten questions for healthcare systems to consider as they develop their strategic path forward: Why Understanding Financial Risk is Important A+B=C = Der L BMW da como LD Understanding asing, mitigating financial risk alth Wales Mad Financial Success (No Margin, No Mission) w www Lachang North BOR wines Monday I 1. How are costs aligned with renul treju tery? 2. What changes in patient care revenue streams are forecast and how quickly wil these changes occur? 3. What increases, decreases, or shifts in utilization are occurring across the system? 4. What partnerships or alliances are shaping the marlot? 3. Where are the greatest opportunities to drive more value in the care delivery improving outcomes, experiences, or efficiency? 6. Is there active engagement with physicians and patients? 7. De current hard and solutsalgs with the strategy, news, and delivery model, and will they scale effectively? & What changes in organisation structure and incentives are needed to achieve desired future performance? 9. What are the greatest opportunities today to strengthen the business, optimin nues, and aligncasts? 10. Are there dieet prioritized goals and the right overnance and data-driven accountability to achieve them? Le chama - 2 Makan Dy Ly | LO ITA | My D 49 50 51 Opportunities for Reducing a Health System's Cost Structure 52


