

Question: Based on information provided in the Excel template, construct a financial model by projecting balance sheet and income statement data for the company for the
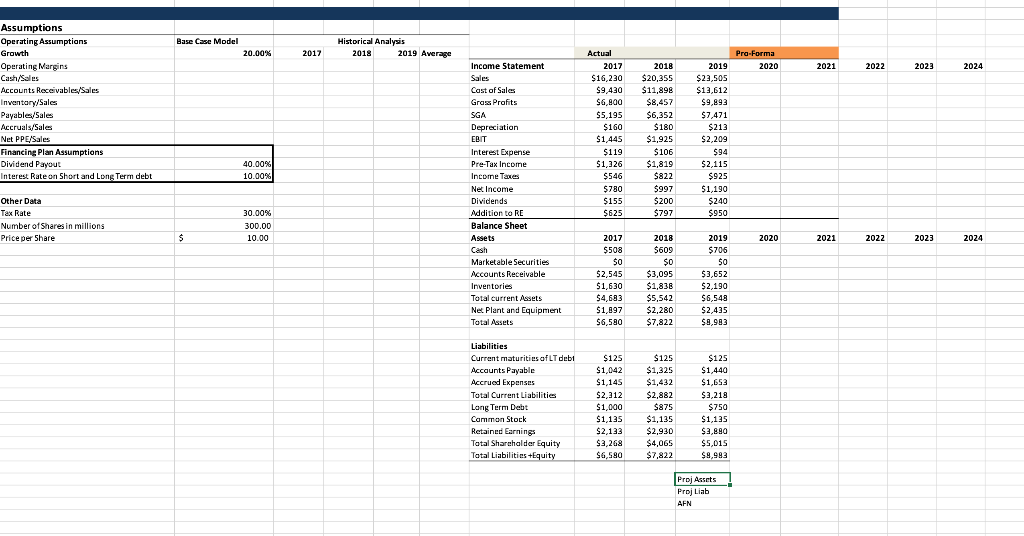
Based on information provided in the Excel template, construct a financial model by projecting balance sheet and income statement data for the company for the next five years. In building your pro-forma financial forecasts, identify operating assumptions on the basis of the most recent three- year average of balance sheet and income statement data. Estimate the AFN needed for each of the next five years on the basis of the following financing plans: a) AFN obtained by issuing long term debt b) 50% of AFN obtained by issuing long term debt and balance 50% AFN obtained by issuing short term debt. c) AFN obtained by issuing equity d) 50% AFN obtained by issuing long term debt and 50% by equity Compare the AFN needed, Debt/Asset Ratio, TIE, ROE, Earnings per share and dividends per share for each of the above four financing plans. Which plan would you recommend? Base Case Model 20.00% Historical Analysis 2018 2019 Average 2017 Pro-Forma 2020 2021 2022 2023 2024 Assumptions Operating Assumptions Growth Operating Margins Cash/Sales Accounts Receivables/Sales Inventory/Sales Payables/Sales Accruals/Sales Net PPL Sales Financing Plan Assumptions Dividend Payout Interest Rate on Short and Long Term debt Actual 2017 $16,230 $9.430 $6,800 $5,195 $160 $1,445 $119 $1,326 $546 $780 $155 $ $625 2018 $20,355 $11,898 $8,457 $6,352 $180 $1,925 Income Statement Sales Cast of Sales Gras Profits SGA Depreciation EBIT Interest Expense Pre-Tax Income Income Taxes Net Income Dividends Addition to RE Balance Sheet Assets Cash Marketable Securities Accounts Receivable Inventories Total current Assets Net Plant and Equipment Total Assets 2019 $22,505 $13,612 $9,893 $7,471 $213 $2,209 $ $94 $2,115 $925 $1,190 $240 $950 $106 40.00% 10.00% $1,819 $822 $997 $200 $797 Other Data Tax Rate Number of Shares in millions Price per Share 30.00% 300.00 10.00 $ 2020 2021 2022 2023 2024 2017 $508 $ $0 $2,545 $1,630 $4,693 $1,897 $6,590 2018 $609 $0 $3,095 $1,838 $5,542 $2,280 $7,822 2019 $706 $0 $3,652 $2,190 $6,543 $2,435 $9,993 Liabilities Current maturities of LT debt Accounts Payable Accrued Expenses Total Current Liabilities Long Term Debt Cammon Stock Retained Earnings Tatal Sharchalder Equity Tatal Liabilities Equity $125 $1,042 $1,145 $2,312 $1,000 $1,135 $2,133 $3,268 $6,580 $125 $1,325 $1,432 $2,882 $875 $1,135 $2,930 $4,065 $7,822 $125 $1,440 $1,653 $3,218 $ $750 $1,125 $3.890 $5,015 $9,993 ProjAssets Proj Liab AFN Based on information provided in the Excel template, construct a financial model by projecting balance sheet and income statement data for the company for the next five years. In building your pro-forma financial forecasts, identify operating assumptions on the basis of the most recent three- year average of balance sheet and income statement data. Estimate the AFN needed for each of the next five years on the basis of the following financing plans: a) AFN obtained by issuing long term debt b) 50% of AFN obtained by issuing long term debt and balance 50% AFN obtained by issuing short term debt. c) AFN obtained by issuing equity d) 50% AFN obtained by issuing long term debt and 50% by equity Compare the AFN needed, Debt/Asset Ratio, TIE, ROE, Earnings per share and dividends per share for each of the above four financing plans. Which plan would you recommend? Base Case Model 20.00% Historical Analysis 2018 2019 Average 2017 Pro-Forma 2020 2021 2022 2023 2024 Assumptions Operating Assumptions Growth Operating Margins Cash/Sales Accounts Receivables/Sales Inventory/Sales Payables/Sales Accruals/Sales Net PPL Sales Financing Plan Assumptions Dividend Payout Interest Rate on Short and Long Term debt Actual 2017 $16,230 $9.430 $6,800 $5,195 $160 $1,445 $119 $1,326 $546 $780 $155 $ $625 2018 $20,355 $11,898 $8,457 $6,352 $180 $1,925 Income Statement Sales Cast of Sales Gras Profits SGA Depreciation EBIT Interest Expense Pre-Tax Income Income Taxes Net Income Dividends Addition to RE Balance Sheet Assets Cash Marketable Securities Accounts Receivable Inventories Total current Assets Net Plant and Equipment Total Assets 2019 $22,505 $13,612 $9,893 $7,471 $213 $2,209 $ $94 $2,115 $925 $1,190 $240 $950 $106 40.00% 10.00% $1,819 $822 $997 $200 $797 Other Data Tax Rate Number of Shares in millions Price per Share 30.00% 300.00 10.00 $ 2020 2021 2022 2023 2024 2017 $508 $ $0 $2,545 $1,630 $4,693 $1,897 $6,590 2018 $609 $0 $3,095 $1,838 $5,542 $2,280 $7,822 2019 $706 $0 $3,652 $2,190 $6,543 $2,435 $9,993 Liabilities Current maturities of LT debt Accounts Payable Accrued Expenses Total Current Liabilities Long Term Debt Cammon Stock Retained Earnings Tatal Sharchalder Equity Tatal Liabilities Equity $125 $1,042 $1,145 $2,312 $1,000 $1,135 $2,133 $3,268 $6,580 $125 $1,325 $1,432 $2,882 $875 $1,135 $2,930 $4,065 $7,822 $125 $1,440 $1,653 $3,218 $ $750 $1,125 $3.890 $5,015 $9,993 ProjAssets Proj Liab AFN
Step by Step Solution
There are 3 Steps involved in it

Get step-by-step solutions from verified subject matter experts