

Question: Based on my calculations and graph created. I need help answering the following questions using this data shown: 1.) Choosing between the three-period and the
Based on my calculations and graph created. I need help answering the following questions using this data shown:
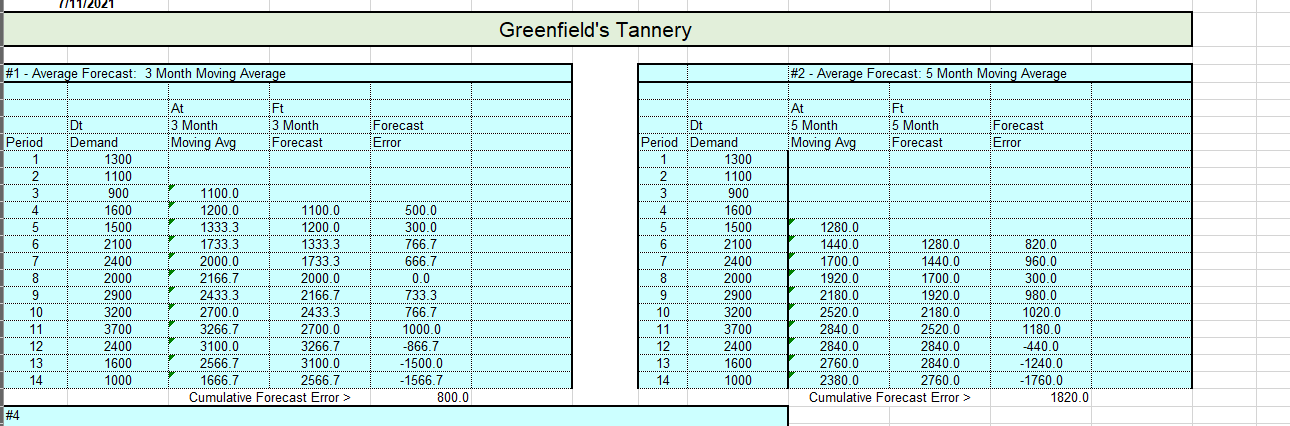
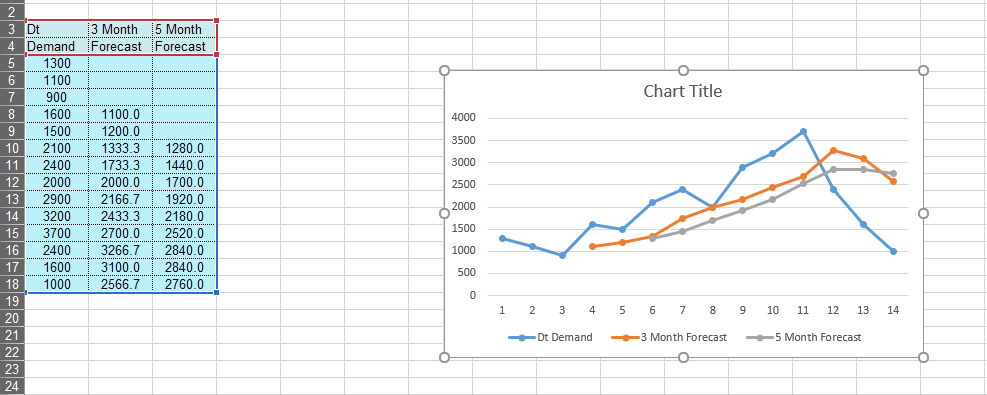
1.) Choosing between the three-period and the five-period forecasts, which length of averaging would you use as a purchasing manager of Greenfields Tannery? Be sure to factor in the cumulative forecast errors in your answer. Also, make sure you include some rationale about why you are picking the method you do for this particular business. So for example, does picking one method over the other have any impact on how much inventory they will have on hand to meet customer demand? What happens when the demand drops? Which method better supports that? Just saying the shorter period reacts more quickly to demand and the longer period smooths things out is not sufficient. Understanding and relaying how the choice impacts inventory levels and inventory costs to the business during slack and peak times, is the competency being assessed.
1/11/2021 Greenfield's Tannery #1 - Average Forecast: 3 Month Moving Average #2 - Average Forecast: 5 Month Moving Average At 3 Month Moving Avg Ft 3 Month Forecast Forecast Error At 5 Month Moving Avg Ft 5 Month Forecast Forecast Error Period 1 2 3 4 4 5 6 7 8 9 10 11 12 13 14 Dt Demand 1300 1100 900 1600 1500 2100 2400 2000 2900 3200 3700 2400 1600 1000 1100.0 1200.0 1100.0 1333.3 1200.0 1733.3 1333.3 2000.0 1733.3 2166.7 2000.0 2433.3 2166.7 2700.0 2433.3 3266.7 2700.0 3100.0 3266.7 2566.7 3100.0 1666.7 2566.7 Cumulative Forecast Error > 500.0 300.0 766.7 666.7 0.0 733.3 766.7 1000.0 -866.7 -1500.0 -1566.7 800.0 Dt Period Demand 1 1 1300 2 1100 3 3 900 4 4 1600 5 1500 6 2100 7 2400 8 2000 9 2900 10 3200 11 3700 12 2400 13 1600 14 1000 1280.0 1440.0 1280.0 1700.0 1440.0 1920.0 17000 2180.0 1920.0 2520.0 2180.0 2840.0 2520.0 2840.0 2840.0 2760.0 2840.0 2380.0 2760.0 Cumulative Forecast Error > 820.0 960.0 300.0 980.0 1020.0 1180.0 -440.0 -1240.0 -1760.0 1820.0 #4 O Chart Title 4000 3500 3000 2500 2 3 Di 3 Month 5 Month 4 Demand Forecast Forecast 5 1300 6 1100 7 900 8 1600 11000 9 1500 12000 10 2100 1333.3 1280.0 11 2400 1733.3 1440.0 12 2000 2000.0 1700.0 13 2900 2166.7 1920.0 14 3200 2433.3 2180.0 15 3700 2700.0 2520.0 16 2400 3266.7 2840.0 17 1600 3100.0 2840.0 18 1000 2566.7 2760.0 19 20 21 22 23 24 2000 1500 1000 500 0 1 2 3 4 5 6 7 8 9 10 11 12 13 14 Dt Demand 3 Month Forecast -5 Month Forecast OStep by Step Solution
There are 3 Steps involved in it

Get step-by-step solutions from verified subject matter experts