

Question: Based on provided information answer following questions: (Please provide citations) Looking at the maps, identify and describe any correlation between the supply of physicians per
Based on provided information answer following questions: (Please provide citations)
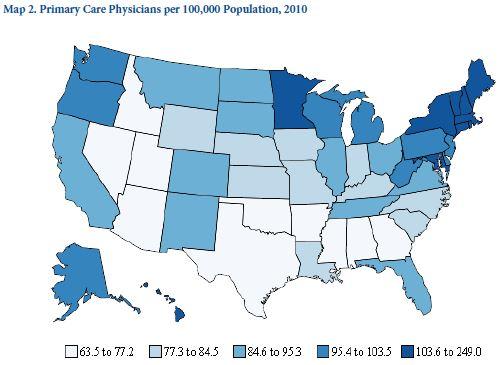
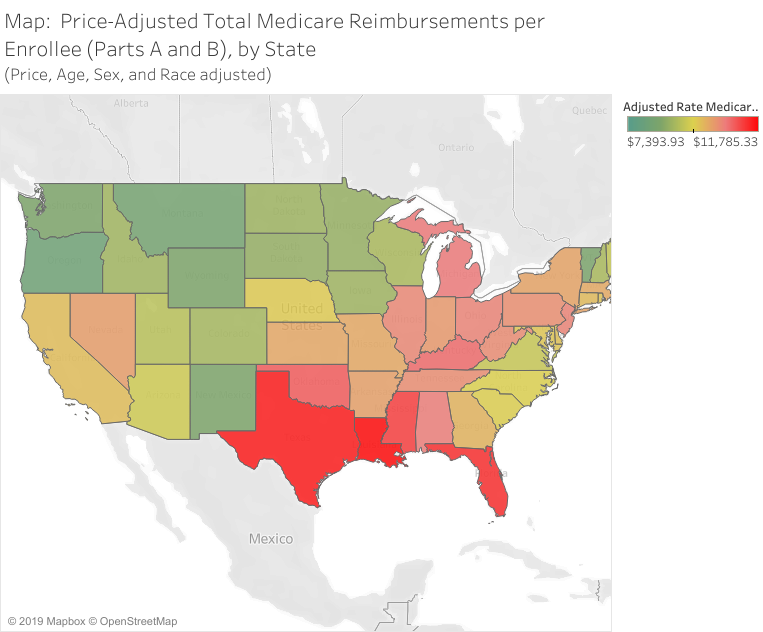
Looking at the maps, identify and describe any correlation between the supply of physicians per capita and the reimbursement per enrollee.
Aside from your explanation in Question 1, what other explanations can you formulate for the wide degree of variation in costs across the country. Recall that the explanation cannot be due to differences in Medicare prices nor the age, sex, or racial make-up of the local area.
Utilization rates follow a similar pattern. Do high utilization rates necessarily indicate the provision of unnecessary care? If not, why not?
As new technologies become available more rapidly for given procedures, would you expect an increased or decreased amount of small-area variation in utilization, costs, and supply?
Map 2. Primary Care Physicians per 100,000 Population, 2010 Map: Price-Adjusted Total Medicare Reimbursements per Enrollee (Parts A and B), by State Adiusted Rate Medicar.. Map 2. Primary Care Physicians per 100,000 Population, 2010 Map: Price-Adjusted Total Medicare Reimbursements per Enrollee (Parts A and B), by State Adiusted Rate Medicar
Step by Step Solution
There are 3 Steps involved in it

Get step-by-step solutions from verified subject matter experts