

Question: Based on stream data sets in Table 1, a machine learning algorithm is applied to evaluate the overall IGCC energy efficiency considering fluctuations the coal
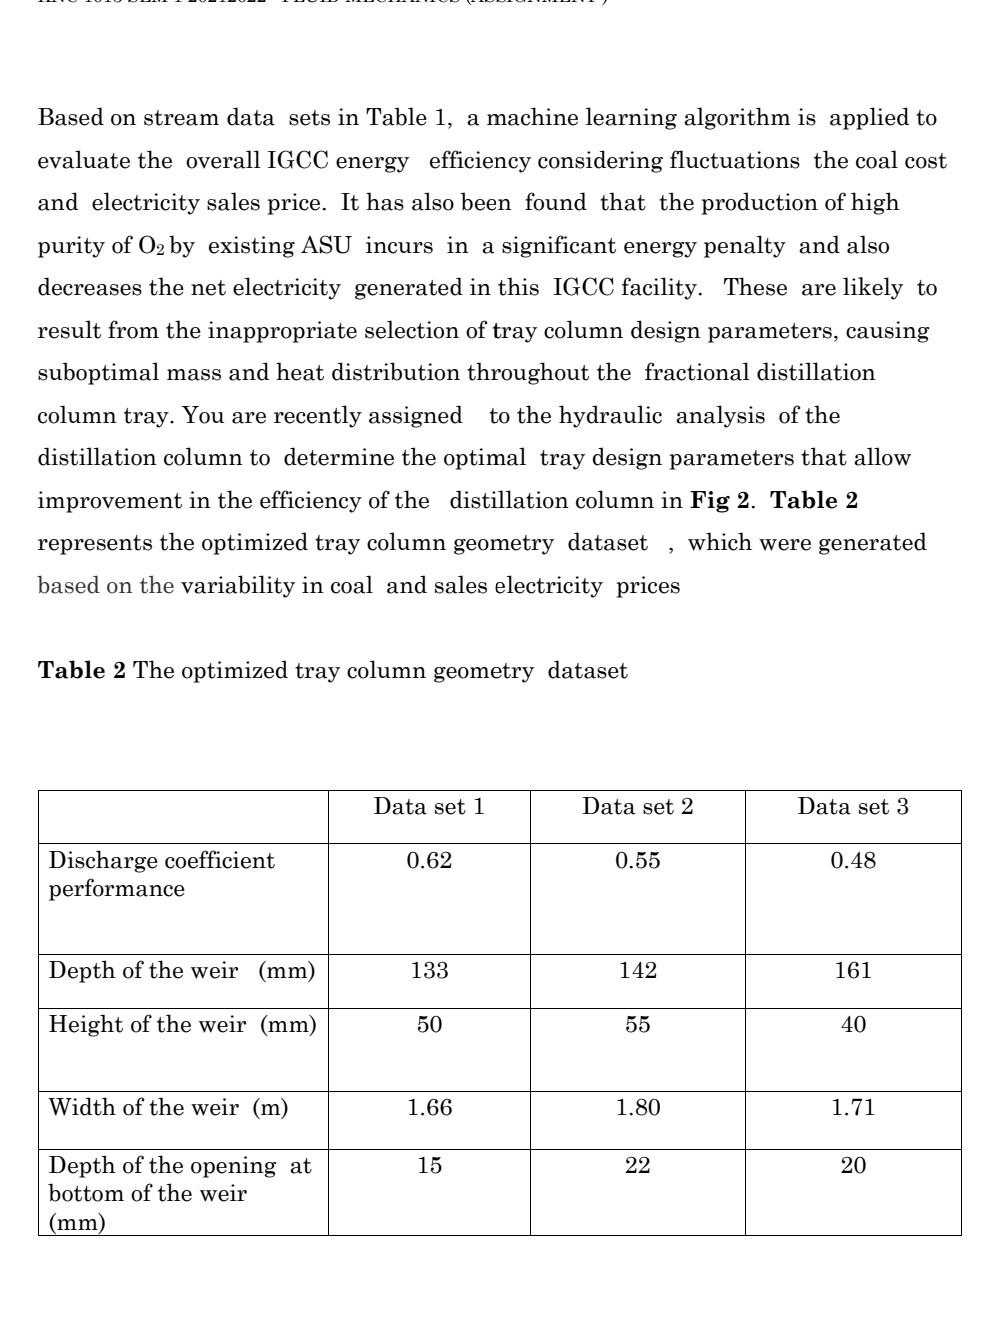
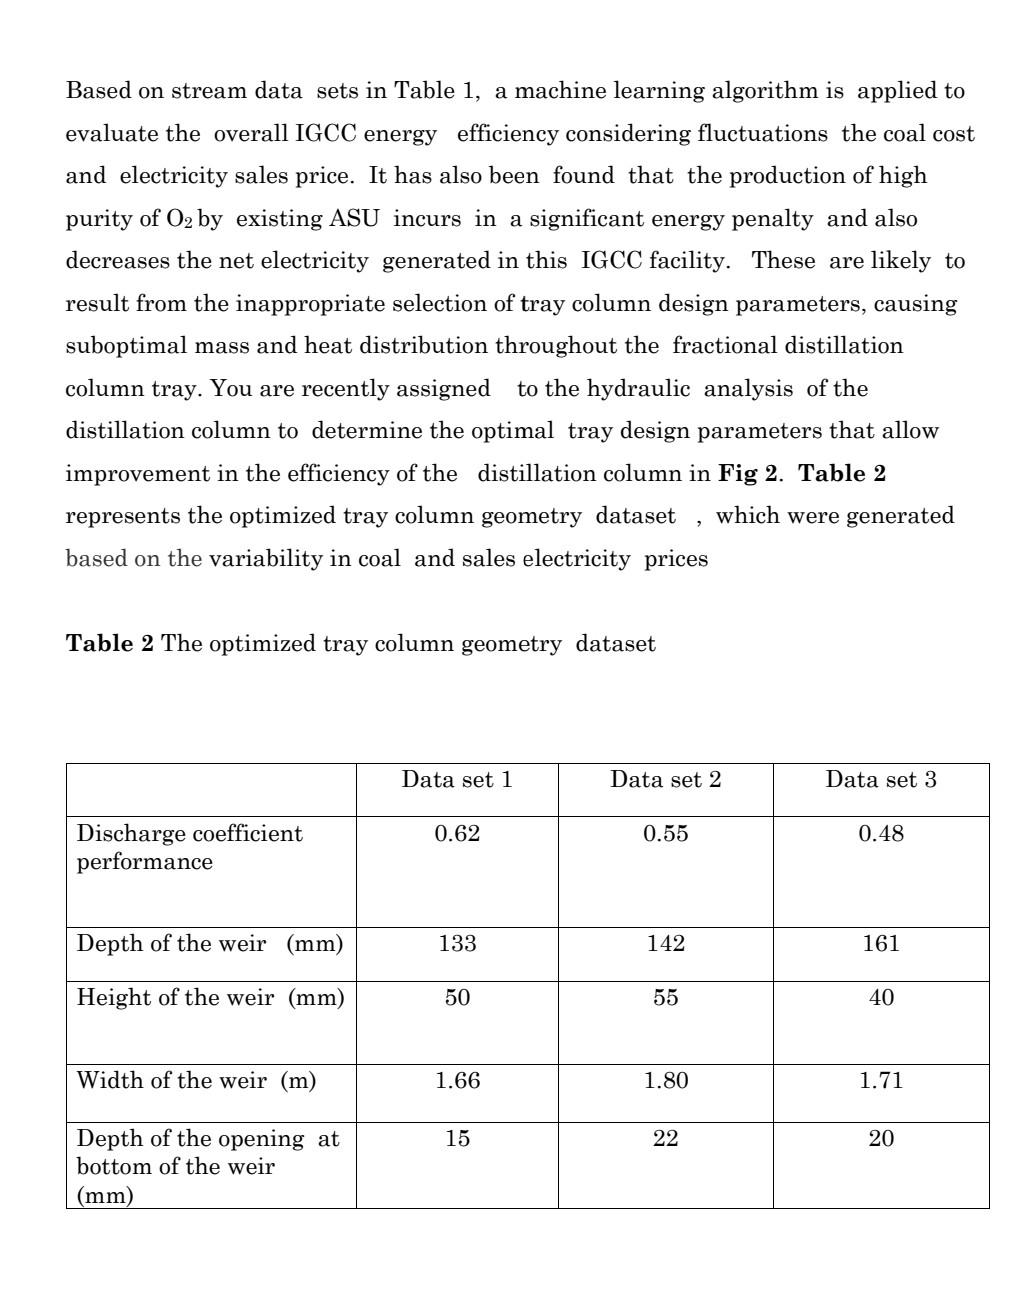
Based on stream data sets in Table 1, a machine learning algorithm is applied to evaluate the overall IGCC energy efficiency considering fluctuations the coal cost and electricity sales price. It has also been found that the production of high purity of O2 by existing ASU incurs in a significant energy penalty and also decreases the net electricity generated in this IGCC facility. These are likely to result from the inappropriate selection of tray column design parameters, causing suboptimal mass and heat distribution throughout the fractional distillation column tray. You are recently assigned to the hydraulic analysis of the distillation column to determine the optimal tray design parameters that allow improvement in the efficiency of the distillation column in Fig 2. Table 2 represents the optimized tray column geometry dataset, which were generated based on the variability in coal and sales electricity prices Table 2 The optimized tray column geometry dataset Based on stream data sets in Table 1, a machine learning algorithm is applied to evaluate the overall IGCC energy efficiency considering fluctuations the coal cost and electricity sales price. It has also been found that the production of high purity of O2 by existing ASU incurs in a significant energy penalty and also decreases the net electricity generated in this IGCC facility. These are likely to result from the inappropriate selection of tray column design parameters, causing suboptimal mass and heat distribution throughout the fractional distillation column tray. You are recently assigned to the hydraulic analysis of the distillation column to determine the optimal tray design parameters that allow improvement in the efficiency of the distillation column in Fig 2. Table 2 represents the optimized tray column geometry dataset, which were generated based on the variability in coal and sales electricity prices Table 2 The optimized tray column geometry dataset
Step by Step Solution
There are 3 Steps involved in it

Get step-by-step solutions from verified subject matter experts