

Question: Based on tabulated data of the temperature and specific volume at P = 5 MPa (T_sat = 263.94 C. v_f = 0.0012862 m^3/kg. v_g =
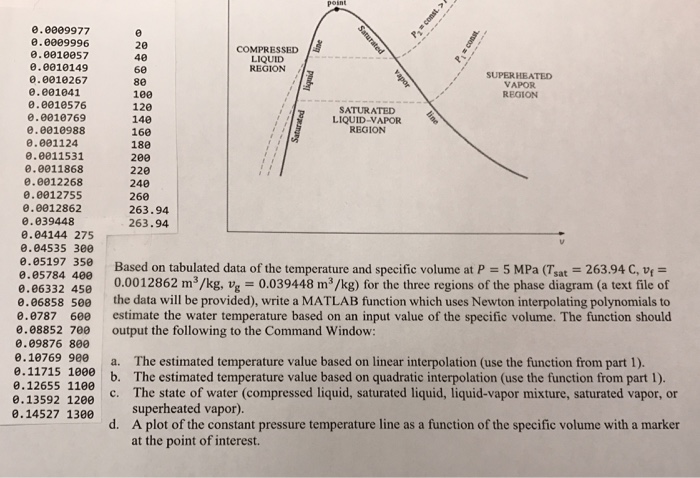
Based on tabulated data of the temperature and specific volume at P = 5 MPa (T_sat = 263.94 C. v_f = 0.0012862 m^3/kg. v_g = 0.039448 m^3/kg) for the three regions of the phase diagram (a text file of the data will be provided), write a MATLAB (unction which uses Newton interpolating polynomials to estimate the water temperature based on an input value of the specific volume. The function should output the following to the Command Window: a. The estimated temperature value based on linear interpolation (use the function from part 1). b. The estimated temperature value based on quadratic interpolation (use the function from part 1). c. The state of water (compressed liquid, saturated liquid, liquid-vapor mixture, saturated vapor, or superheated vapor). d. A plot of the constant pressure temperature line as a function of the specific volume with a marker at the point of interest
Step by Step Solution
There are 3 Steps involved in it

Get step-by-step solutions from verified subject matter experts