

Question: Based on the 10-year bond yields shown in the figure below, which country has experienced the largest decrease in borrowing costs over the past

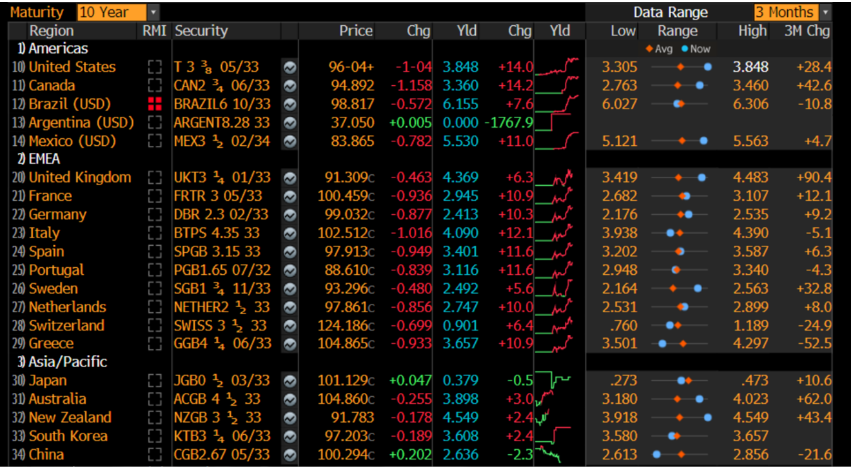
Based on the 10-year bond yields shown in the figure below, which country has experienced the largest decrease in borrowing costs over the past 3 months? Maturity 10 Year Region 1) Americas 10) United States RMI Security Data Range Price Chg Yld Chg Yld Low Range 3 Months High 3M Chg Avg Now 11) Canada 12) Brazil (USD) 13) Argentina (USD) 14 Mexico (USD) [T33 05/33 CAN2 34 06/33 BRAZIL6 10/33 ARGENT8.28 33 MEX302/34 96-04+ -1-04 3.848 +14.0 94.892 -1.158 3.360 +14.2 98.817 -0.572 6.155 3.305 3.848 +28.4 2.763 3.460 +42.6 +7.6 6.027 6.306 -10.8 37.050 +0.005 0.000 -1767.9 83.865 -0.782 5.530 +11.0 5.121 5.563 +4.7 2) EMEA 20 United Kingdom UKT3 4 01/33 91.309c -0.463 4.369 +6.3 3.419 4.483 +90.4 21) France 22) Germany 23) Italy 24 Spain [FRTR 3 05/33 [DBR 2.3 02/33 [BTPS 4.35 33 [SPGB 3.15 33 100.459c -0.936 2.945 +10.9 2.682 3.107 +12.1 25) Portugal 26 Sweden 27) Netherlands 28) Switzerland PGB1.65 07/32 [SGB1 34 11/33 NETHER233 SWISS 333 29) Greece GGB4 14 06/33 99.032c -0.877 2.413 102.512c -1.016 4.090 97.913c -0.949 3.401 88.610c -0.839 3.116 93.296c -0.480 2.492 97.861c -0.856 2.747 124.186c -0.699 0.901 104.865c -0.933 3.657 +10.3 2.176 2.535 +9.2 +12.1 3.938 4.390 -5.1 +11.6 3.202 3.587 +6.3 +11.6___* 2.948 3.340 -4.3 +5.6 2.164 2.563 +32.8 +10.0 2.531 2.899 +8.0 +6.4 .760 1.189 -24.9 +10.9 3.501 4.297 -52.5 3) Asia/Pacific 30 Japan JGBO 03/33 31) Australia ACGB 433 32) New Zealand 33) South Korea 34 China NZGB 333 [KTB3 4 06/33 101.129 +0.047 0.379 104.860c 91.783 -0.178 4.549 -0.5 .273 .473 +10.6 -0.255 3.898 +3.0 3.180 4.023 +62.0 +2.4 3.918 4.549 +43.4 CGB2.67 05/33 97.203 100.294c +0.202 2.636 -0.189 3.608 +2.4 3.580 3.657 -2.3 2.613 2.856 -21.6
Step by Step Solution
There are 3 Steps involved in it

Get step-by-step solutions from verified subject matter experts