

Based on the Bloomberg DDM screenshots below, which company is the most undervalued and which is...
Fantastic news! We've Found the answer you've been seeking!
Question:
Transcribed Image Text:
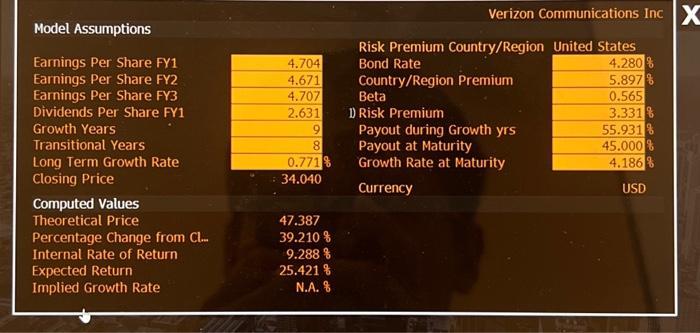
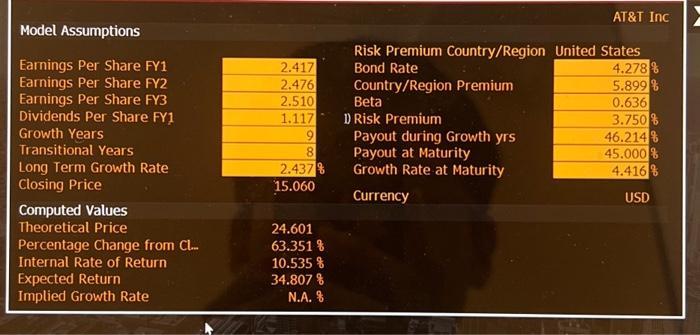
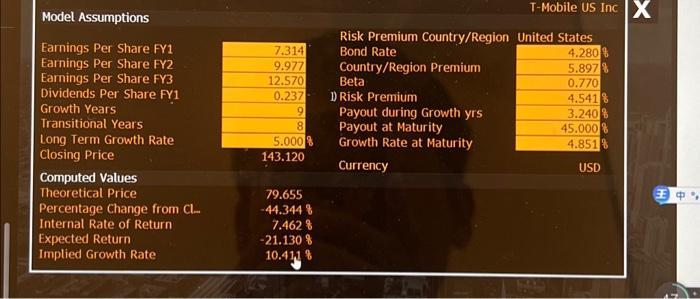
Based on the Bloomberg DDM screenshots below, which company is the most undervalued and which is the most overvalued on a percentage basis? AT&T is the most undervalued and T-Mobile is the most overvalued. AT&T is the most overvalued and T-Mobile is the most undervalued. Verizon is the most undervalued and AT&T is the most overvalued. Model Assumptions Earnings Per Share FY1 Earnings Per Share FY2 Earnings Per Share FY3 Dividends Per Share FY1 Growth Years Transitional Years Long Term Growth Rate Closing Price Computed Values Theoretical Price Percentage Change from Cl... Internal Rate of Return Expected Return Implied Growth Rate 4.704 4.671 4.707 2.631 9 8 0.771% 34.040 47.387 39.210 % 9.288% 25.421 % N.A. % Verizon Communications Inc X Risk Premium Country/Region United States Bond Rate 4.280 % Country/Region Premium Beta 1) Risk Premium Payout during Growth yrs Payout at Maturity Growth Rate at Maturity Currency 5.897% 0.565 3.331 55.931% 45.000% 4.186% USD Model Assumptions Earnings Per Share FY1 Earnings Per Share FY2 Earnings Per Share FY3 Dividends Per Share FY1 Growth Years Transitional Years Long Term Growth Rate Closing Price Computed Values Theoretical Price Percentage Change from Cl... Internal Rate of Return Expected Return Implied Growth Rate 2.417 2.476 2.510 1.117 9 8 2.437% 15.060 24.601 63.351 % 10.535% 34.807 % N.A. % Risk Premium Country/Region United States Bond Rate Country/Region Premium Beta 1) Risk Premium AT&T Inc Payout during Growth yrs Payout at Maturity Growth Rate at Maturity Currency 4.278% 5.899% 0.636 3.750% 46.214% 45.000 4.416% USD Model Assumptions Earnings Per Share FY1 Earnings Per Share FY2 Earnings Per Share FY3 Dividends Per Share FY1 Growth Years Transitional Years Long Term Growth Rate Closing Price Computed Values Theoretical Price Percentage Change from Cl.. Internal Rate of Return Expected Return Implied Growth Rate 7.314 9.977 12.570 0.237 9 8 5.000% 143.120 14 79.655 -44.3448 7.462 % -21.130% 10.411 % Risk Premium Country/Region United States Bond Rate Country/Region Premium Beta 1) Risk Premium Payout during Growth yrs Payout at Maturity Growth Rate at Maturity Currency T-Mobile US Inc X EXAN Wilkin 4.280% 5.897% 0.770 4.5418 3.2408 45.000% 4.851% USD Based on the Bloomberg DDM screenshots below, which company is the most undervalued and which is the most overvalued on a percentage basis? AT&T is the most undervalued and T-Mobile is the most overvalued. AT&T is the most overvalued and T-Mobile is the most undervalued. Verizon is the most undervalued and AT&T is the most overvalued. Model Assumptions Earnings Per Share FY1 Earnings Per Share FY2 Earnings Per Share FY3 Dividends Per Share FY1 Growth Years Transitional Years Long Term Growth Rate Closing Price Computed Values Theoretical Price Percentage Change from Cl... Internal Rate of Return Expected Return Implied Growth Rate 4.704 4.671 4.707 2.631 9 8 0.771% 34.040 47.387 39.210 % 9.288% 25.421 % N.A. % Verizon Communications Inc X Risk Premium Country/Region United States Bond Rate 4.280 % Country/Region Premium Beta 1) Risk Premium Payout during Growth yrs Payout at Maturity Growth Rate at Maturity Currency 5.897% 0.565 3.331 55.931% 45.000% 4.186% USD Model Assumptions Earnings Per Share FY1 Earnings Per Share FY2 Earnings Per Share FY3 Dividends Per Share FY1 Growth Years Transitional Years Long Term Growth Rate Closing Price Computed Values Theoretical Price Percentage Change from Cl... Internal Rate of Return Expected Return Implied Growth Rate 2.417 2.476 2.510 1.117 9 8 2.437% 15.060 24.601 63.351 % 10.535% 34.807 % N.A. % Risk Premium Country/Region United States Bond Rate Country/Region Premium Beta 1) Risk Premium AT&T Inc Payout during Growth yrs Payout at Maturity Growth Rate at Maturity Currency 4.278% 5.899% 0.636 3.750% 46.214% 45.000 4.416% USD Model Assumptions Earnings Per Share FY1 Earnings Per Share FY2 Earnings Per Share FY3 Dividends Per Share FY1 Growth Years Transitional Years Long Term Growth Rate Closing Price Computed Values Theoretical Price Percentage Change from Cl.. Internal Rate of Return Expected Return Implied Growth Rate 7.314 9.977 12.570 0.237 9 8 5.000% 143.120 14 79.655 -44.3448 7.462 % -21.130% 10.411 % Risk Premium Country/Region United States Bond Rate Country/Region Premium Beta 1) Risk Premium Payout during Growth yrs Payout at Maturity Growth Rate at Maturity Currency T-Mobile US Inc X EXAN Wilkin 4.280% 5.897% 0.770 4.5418 3.2408 45.000% 4.851% USD
Expert Answer:

Related Book For 

Posted Date:
Students also viewed these finance questions
-
Evaluate the integral ff 2xy dA over the region R. 1 D (1.4) 0 1 Question 2 (15 marks) Evaluate the integral 2+x3 dxdy by reversing the order of integration. y Question 3 (15 marks) Evaluate the...
-
3. Suppose that Apples profits have always been expected to grow twice as fast as Microsofts. Does it necessarily make Apple stock a better investment than Microsoft stock based on the Efficient...
-
Founded by Jeff Bezos, online giant Amazon.com, Inc. (Amazon), was incorporated in the state of Washington in July, 1994, and sold its first book in July, 1995. In May 1997, Amazon (AMZN) completed...
-
Pacific Company sells electronic test equipment that it acquires from a foreign source. During the year 2014, the inventory records reflected the following: Inventory is valued at cost using the LIFO...
-
In a nuclear fission reaction, which has more mass: the initial uranium or its products?
-
You are considering investing in two securities, X and Y, and have the following information: (a) Calculate the expected return for each security separately and for a portfolio of 60 per cent X and...
-
In a study to determine the relationship between ambient outdoor temperature and the rate of evaporation of water from soil, measurements of average daytime temperature in C and evaporation in...
-
Steve has been operating Castle Creek Restaurant in Ontario for the past several years. On the basis of the information that Steves accountant filed with the CRA during the prior year, Castle Creek...
-
Swifty Itzek manufactures and sells homemade wine, and he wants to develop a standard cost per gallon. The following are required for production of a 50-gallon batch. 2,880 ounces of grape...
-
The Classic Furniture Company is trying to determine the optimal quantities to make of six possible products: tables and chairs made of oak, cherry, and pine. The products are to be made using the...
-
Alison Arbitrage was hired fresh out of college by Debenture Option Warrant Co. ("DOW"), a securities trading firm. When Alison accepted the job, she signed a noncompetition agreement that barred her...
-
How are externalities related to the efficiency of competitive market equilibrium?
-
Describe the roles of a booster, a handler, and a fence.
-
Very few economists would favor centrally planned economies, and few would favor an economy completely governed by markets. Why is a certain level of government intervention needed, even in market...
-
Who are shoplifters? What is a common way to classify shoplifters?
-
David Ricardo was the first economist to suggest that two countries can benefit from trade even if one was less productive in all sectors of the economy. Explain the reasoning behind this suggestion...
-
Stannard PC Plus, Inc. repairs & sells new computers. The ending balance in the inventory account on September 30, 2012 was 9 units at $260 per unit. The company uses a perpetual inventory system and...
-
What are technical skills At what level are they most important and why?
-
Complete the following table describing the short-run daily costs of the Attractive Magnet Co. for2009. Total Total Costs Total Costs Fixed Costs Costs Total Costs Costs S 30 Average Product Total...
-
a. What is the relationship between the natural rate of unemployment and frictional, structural, and cyclical unemployment? b. What would happen to both unemployment and the normal rate of...
-
Multiple Choice Questions: 1. If output prices rise faster than money wages, the likely result will be that? a. Real wages will fall, as will the unemployment rate. b. Real wages will fall, and the...
-
What steps are necessary to record services performed on account for Wild Water Sports?
-
How does the QuickBooks Accountant software respond if a bill is entered with a vendor name that is not included on the vendor list?
-
What are the steps for paying sales tax?

Study smarter with the SolutionInn App