

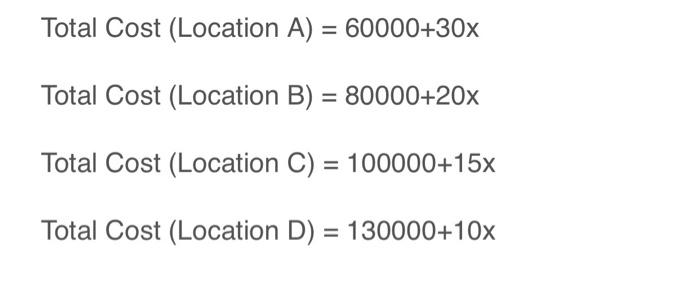
Question: Based on the calculations below, draw the total cost lines for each of the location on the same axes. (Use output ranges of 200, 400,
Based on the calculations below, draw the total cost lines for each of the location on the same axes. (Use output ranges of 200, 400, 600, 800 etc. and intervals of $50,000 on the Y axis.
Step by Step Solution
There are 3 Steps involved in it
1 Expert Approved Answer
Step: 1 Unlock

Question Has Been Solved by an Expert!
Get step-by-step solutions from verified subject matter experts
Step: 2 Unlock
Step: 3 Unlock