

Question: Based on the calculations in dollar amounts: 1, What do each of the measures mean? 2.how do i interpret calculations ? 3.What does the data
Based on the calculations in dollar amounts:
1, What do each of the measures mean?
2.how do i interpret calculations ?
3.What does the data say about distribution (normal or something else)?
4.How do I calculate and analyze the confidence interval lower and upper?
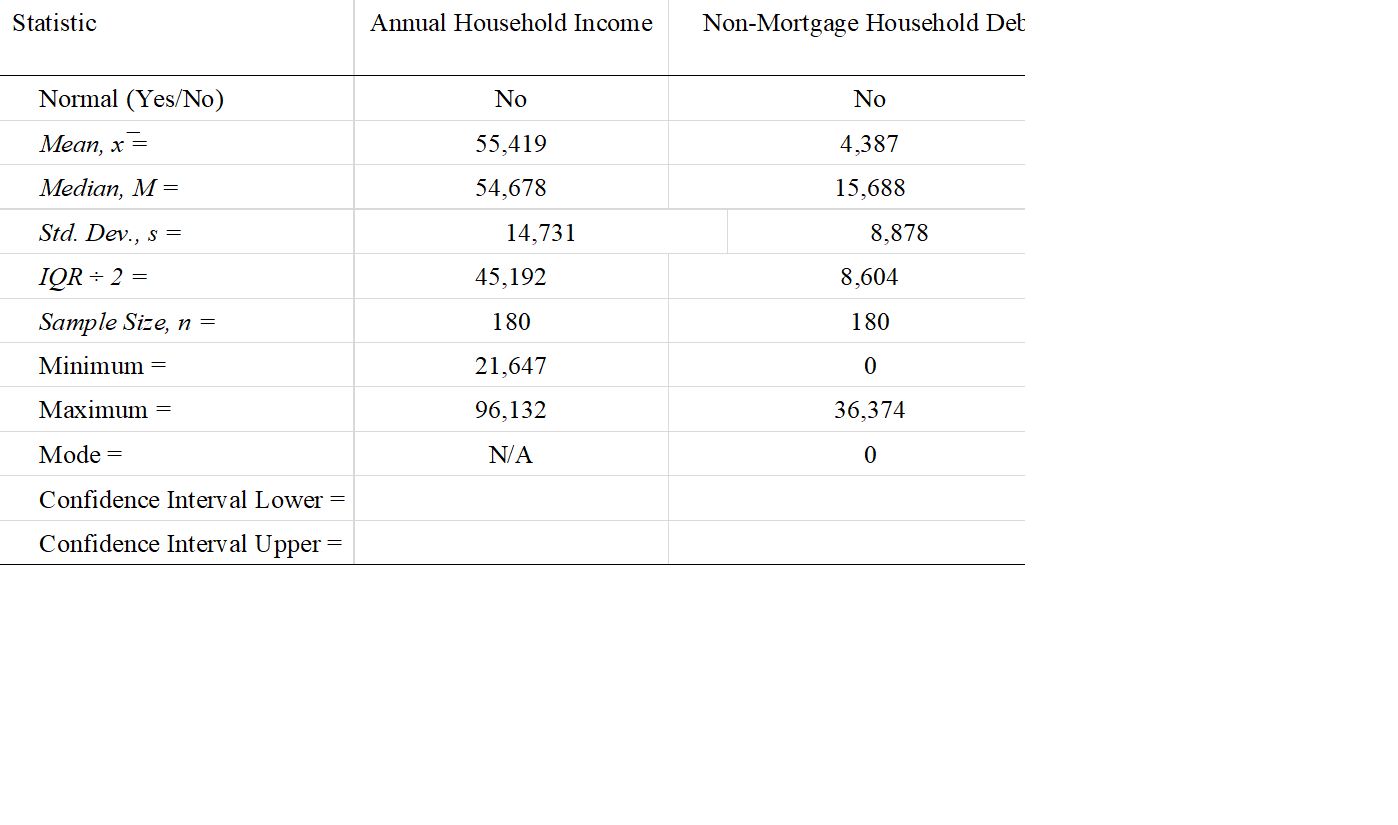
Statistic Annual Household Income Non-Mortgage Household Det Normal (Yes/No) No No Mean, x = 55,419 4,387 Median, M = 54,678 15,688 Std. Dev., s = 14,731 8,878 IOR + 2 = 45,192 8,604 Sample Size, n = 180 180 Minimum = 21,647 0 Maximum = 96,132 36,374 Mode = N/A 0 Confidence Interval Lower = Confidence Interval Upper =
Step by Step Solution
There are 3 Steps involved in it
1 Expert Approved Answer
Step: 1 Unlock

Question Has Been Solved by an Expert!
Get step-by-step solutions from verified subject matter experts
Step: 2 Unlock
Step: 3 Unlock