

Question: Based on the chart below, which forecast is better? What is the MAD for forecast 1 and forecast 2 respectively? Keep two decimals in
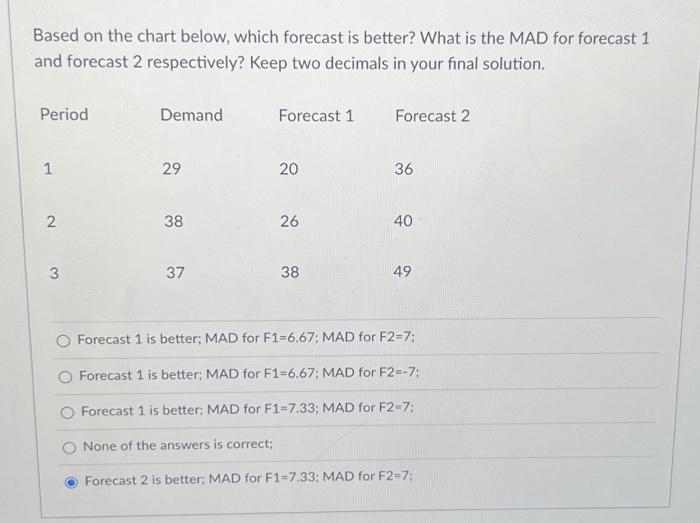
Based on the chart below, which forecast is better? What is the MAD for forecast 1 and forecast 2 respectively? Keep two decimals in your final solution. Forecast 1 Forecast 2 Period Demand 1 29 20 20 36 2 38 26 40 3 37 38 49 Forecast 1 is better; MAD for F1-6.67; MAD for F2=7; Forecast 1 is better; MAD for F1-6.67; MAD for F2=-7; Forecast 1 is better; MAD for F1-7.33; MAD for F2-7; None of the answers is correct; Forecast 2 is better; MAD for F1-7.33; MAD for F2=7;
Step by Step Solution
There are 3 Steps involved in it
1 Expert Approved Answer
Step: 1 Unlock

Question Has Been Solved by an Expert!
Get step-by-step solutions from verified subject matter experts
Step: 2 Unlock
Step: 3 Unlock