

Question: Based on the chart, Please fill in the chart by calculating Strike, Breakeven Point, Max Profit, and Max Loss for the Uncovered call seller (Please
Based on the chart, Please fill in the chart by calculating Strike, Breakeven Point, Max Profit, and Max Loss for the Uncovered call seller (Please show work for calculation for each column)
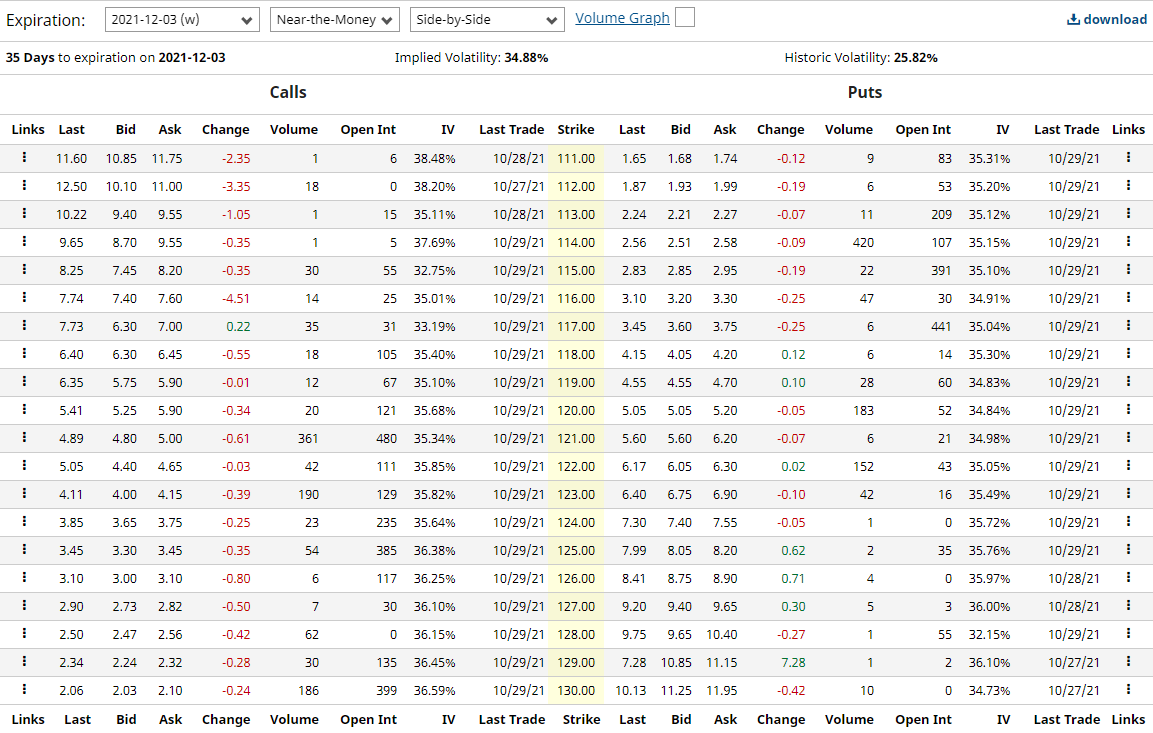
Chart:
| Strike = ? | Breakeven Point | Max Profit | Max Loss |
Guidance:
Use the same strike as for the uncovered call buyer.
Expiration: 2021-12-03 (w) Near-the-Money Side-by-Side V Volume Graph download 35 Days to expiration on 2021-12-03 Implied Volatility: 34.88% Historic Volatility: 25.82% Calls Puts Links Last Bid Ask Change Volume Open Int IV Last Trade Strike Last Bid Ask Change Volume Open Int IV Last Trade Links 11.60 10.85 11.75 -2.35 1 6 38.48% 10/28/21 111.00 1.65 1.68 1.74 -0.12 9 83 35.31% 10/29/21 12.50 10.10 11.00 -3.35 18 0 38.20% 10/27/21 112.00 1.87 1.93 1.99 -0.19 6 53 35.20% 10/29/21 10.22 9.40 9.55 -1.05 1 15 35.11% % 10/28/21 113.00 2.24 2.21 2.27 -0.07 11 209 35.12% 10/29/21 9.65 8.70 9.55 -0.35 1 5 37.69% 10/29/21 114.00 2.56 2.51 2.58 -0.09 420 107 35.15% 10/29/21 8.25 7.45 8.20 -0.35 30 55 32.75% 10/29/21 115.00 2.83 2.85 2.95 -0.19 22 391 35.10% 10/29/21 7.74 7.40 7.60 -4.51 14 25 35.01% 10/29/21 116.00 3.10 3.20 3.30 -0.25 47 30 34.91% 10/29/21 7.73 6.30 7.00 0.22 35 31 33.19% 10/29/21 117.00 3.45 3.60 3.75 -0.25 6 441 35.04% 10/29/21 6.40 6.30 6.45 -0.55 18 105 35.40% 10/29/21 118.00 4.15 4.05 4.20 0.12 6 14 35.30% 10/29/21 6.35 5.75 5.90 -0.01 12 67 35.10% 10/29/21 119.00 4.55 4.55 4.70 0.10 28 60 34.83% 10/29/21 5.41 5.25 5.90 -0.34 20 121 35.68% 10/29/21 120.00 5.05 5.05 5.20 -0.05 183 52 34.84% 10/29/21 4.89 4.80 5.00 -0.61 361 480 35.34% 10/29/21 121.00 5.60 5.60 6.20 -0.07 6 21 34.98% 10/29/21 5.05 4.40 4.65 -0.03 42 111 35.85% 10/29/21 122.00 6.17 6.05 6.30 0.02 152 43 35.05% 10/29/21 4.11 4.00 4.15 -0.39 190 129 35.82% 10/29/21 123.00 6.40 6.75 6.90 -0.10 42 16 35.49% 10/29/21 3.85 3.65 3.75 -0.25 23 235 35.64% 10/29/21 124.00 7.30 7.40 7.55 -0.05 1 0 35.72% 10/29/21 : 3.45 3.30 3.45 -0.35 54 385 36.38% 10/29/21 125.00 7.99 8.05 8.20 0.62 2 35 35.76% 10/29/21 3.10 3.00 3.10 -0.80 6 117 36.25% 10/29/21 126.00 8.41 8.75 8.90 0.71 4 0 35.97% 10/28/21 2.90 2.73 2.82 -0.50 7 30 36.10% 10/29/21 127.00 9.20 9.40 9.65 0.30 5 3 36.00% 10/28/21 2.50 2.47 2.56 -0.42 62 0 36.15% 10/29/21 128.00 9.75 9.65 10.40 -0.27 1 55 32.15% 10/29/21 1 2.34 2.24 2.32 -0.28 30 135 36.45% 10/29/21 129.00 7.28 10.85 11.15 7.28 1 2 36.10% 10/27/21 2.06 2.03 2.10 -0.24 186 399 36.59% 10/29/21 130.00 10.13 11.25 11.95 -0.42 10 0 34.73% 10/27/21 1 Links Last Bid Ask Change Volume Open Int IV Last Trade Strike Last Bid Ask Change Volume Open Int IV Last Trade Links Expiration: 2021-12-03 (w) Near-the-Money Side-by-Side V Volume Graph download 35 Days to expiration on 2021-12-03 Implied Volatility: 34.88% Historic Volatility: 25.82% Calls Puts Links Last Bid Ask Change Volume Open Int IV Last Trade Strike Last Bid Ask Change Volume Open Int IV Last Trade Links 11.60 10.85 11.75 -2.35 1 6 38.48% 10/28/21 111.00 1.65 1.68 1.74 -0.12 9 83 35.31% 10/29/21 12.50 10.10 11.00 -3.35 18 0 38.20% 10/27/21 112.00 1.87 1.93 1.99 -0.19 6 53 35.20% 10/29/21 10.22 9.40 9.55 -1.05 1 15 35.11% % 10/28/21 113.00 2.24 2.21 2.27 -0.07 11 209 35.12% 10/29/21 9.65 8.70 9.55 -0.35 1 5 37.69% 10/29/21 114.00 2.56 2.51 2.58 -0.09 420 107 35.15% 10/29/21 8.25 7.45 8.20 -0.35 30 55 32.75% 10/29/21 115.00 2.83 2.85 2.95 -0.19 22 391 35.10% 10/29/21 7.74 7.40 7.60 -4.51 14 25 35.01% 10/29/21 116.00 3.10 3.20 3.30 -0.25 47 30 34.91% 10/29/21 7.73 6.30 7.00 0.22 35 31 33.19% 10/29/21 117.00 3.45 3.60 3.75 -0.25 6 441 35.04% 10/29/21 6.40 6.30 6.45 -0.55 18 105 35.40% 10/29/21 118.00 4.15 4.05 4.20 0.12 6 14 35.30% 10/29/21 6.35 5.75 5.90 -0.01 12 67 35.10% 10/29/21 119.00 4.55 4.55 4.70 0.10 28 60 34.83% 10/29/21 5.41 5.25 5.90 -0.34 20 121 35.68% 10/29/21 120.00 5.05 5.05 5.20 -0.05 183 52 34.84% 10/29/21 4.89 4.80 5.00 -0.61 361 480 35.34% 10/29/21 121.00 5.60 5.60 6.20 -0.07 6 21 34.98% 10/29/21 5.05 4.40 4.65 -0.03 42 111 35.85% 10/29/21 122.00 6.17 6.05 6.30 0.02 152 43 35.05% 10/29/21 4.11 4.00 4.15 -0.39 190 129 35.82% 10/29/21 123.00 6.40 6.75 6.90 -0.10 42 16 35.49% 10/29/21 3.85 3.65 3.75 -0.25 23 235 35.64% 10/29/21 124.00 7.30 7.40 7.55 -0.05 1 0 35.72% 10/29/21 : 3.45 3.30 3.45 -0.35 54 385 36.38% 10/29/21 125.00 7.99 8.05 8.20 0.62 2 35 35.76% 10/29/21 3.10 3.00 3.10 -0.80 6 117 36.25% 10/29/21 126.00 8.41 8.75 8.90 0.71 4 0 35.97% 10/28/21 2.90 2.73 2.82 -0.50 7 30 36.10% 10/29/21 127.00 9.20 9.40 9.65 0.30 5 3 36.00% 10/28/21 2.50 2.47 2.56 -0.42 62 0 36.15% 10/29/21 128.00 9.75 9.65 10.40 -0.27 1 55 32.15% 10/29/21 1 2.34 2.24 2.32 -0.28 30 135 36.45% 10/29/21 129.00 7.28 10.85 11.15 7.28 1 2 36.10% 10/27/21 2.06 2.03 2.10 -0.24 186 399 36.59% 10/29/21 130.00 10.13 11.25 11.95 -0.42 10 0 34.73% 10/27/21 1 Links Last Bid Ask Change Volume Open Int IV Last Trade Strike Last Bid Ask Change Volume Open Int IV Last Trade Links
Step by Step Solution
There are 3 Steps involved in it

Get step-by-step solutions from verified subject matter experts