

Question: Based on the charts given, we must infer how much each quantile (20%) would reciever in each of the 3 given scenarios Preferred Distribution of
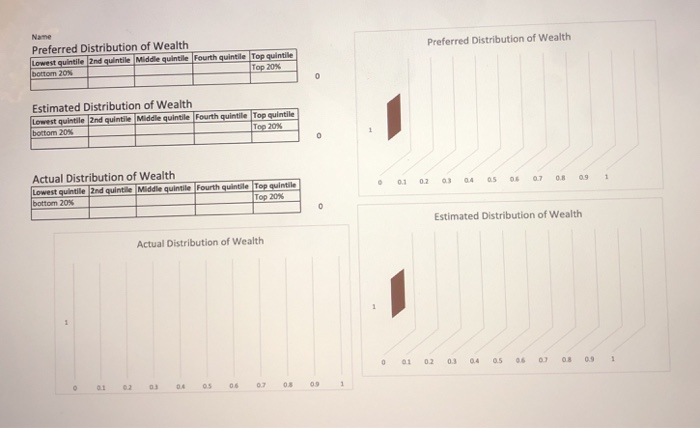
Preferred Distribution of Wealth Name Preferred Distribution of Wealth Lowest quintile 2nd quintile Middle quintile Fourth quintile Top quintile bottom 20% Top 20% 0 Estimated Distribution of Wealth Lowest quintile 2nd quintile Middle quintile Fourth quintile Top quintile bottom 20% Top 20% 0.1 0.2 04 05 Actual Distribution of Wealth Lowest quintile 2nd quintile Middle quintile Fourth quintile Top quintile bottom 20% Top 20% 0 Estimated Distribution of Wealth Actual Distribution of Wealth 1 0 02 0.3 0 08 09 1 04 05 06 Preferred Distribution of Wealth Name Preferred Distribution of Wealth Lowest quintile 2nd quintile Middle quintile Fourth quintile Top quintile bottom 20% Top 20% 0 Estimated Distribution of Wealth Lowest quintile 2nd quintile Middle quintile Fourth quintile Top quintile bottom 20% Top 20% 0.1 0.2 04 05 Actual Distribution of Wealth Lowest quintile 2nd quintile Middle quintile Fourth quintile Top quintile bottom 20% Top 20% 0 Estimated Distribution of Wealth Actual Distribution of Wealth 1 0 02 0.3 0 08 09 1 04 05 06
Step by Step Solution
There are 3 Steps involved in it

Get step-by-step solutions from verified subject matter experts