

Question: Based on the Chi Square Tests chart below, how many groups were in this study? Value df Asymp. Sig (2-sided) Pearson Chi-Square 10.949a 2 004

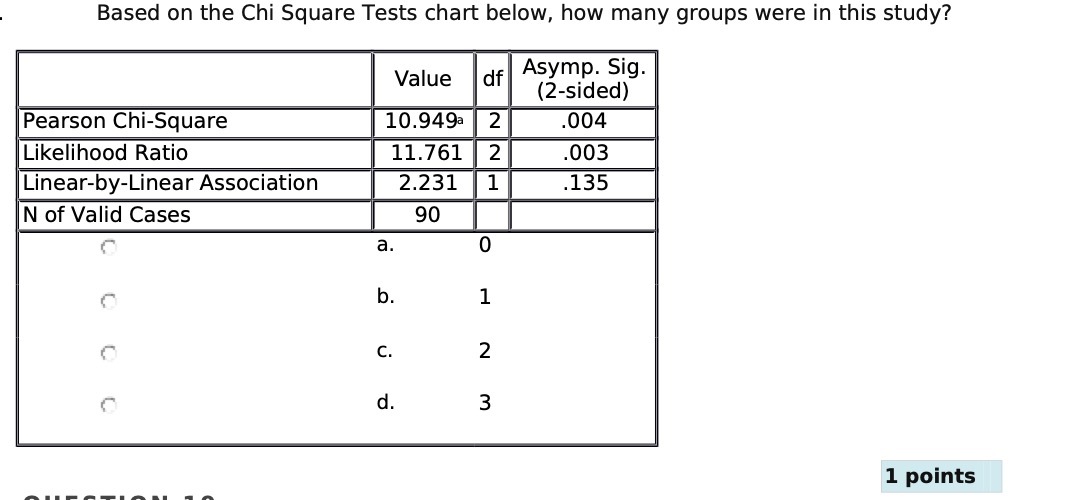
Based on the Chi Square Tests chart below, how many groups were in this study? Value df Asymp. Sig (2-sided) Pearson Chi-Square 10.949a 2 004 Likelihood Ratio 11.761 2 003 Linear-by-Linear Association 2.231 1 135 N of Valid Cases 90 a. 0 b 1 C. 2 d. 3 1 points
Step by Step Solution
There are 3 Steps involved in it
1 Expert Approved Answer
Step: 1 Unlock

Question Has Been Solved by an Expert!
Get step-by-step solutions from verified subject matter experts
Step: 2 Unlock
Step: 3 Unlock