Question: Based on the current forecasts, which of the forecast methods is optimal (performing best) based on the three Forecast Accuracy measurements. explain why M&M Sales

Based on the current forecasts, which of the forecast methods is optimal (performing best) based on the three Forecast Accuracy measurements. explain why Based on the current forecasts, which of the

M&M Sales Trends (Cases Sold) M&M Sales Forecasting Tool 7500 7000 6500 & 6000 S500 2018 Actual 2019 Total Actual Sold 2019 Total Sold (Cases) Forecast (Cases) 5734 January 5801 5823 February 5945 5684 March 5700 7134 April 6958 6587 May 6520 5935 June 5785 6005 July 6102 6325 August 6459 6251 September 7210 October 6900 November 7059 December 2018 Sales January February March April May June July August September October November December Actual Growth 1.17% 2.10% 0.28%. -2.47% -1.02%. -2.53% 1.62%. 2.12% 2019 Forecas t Growth Over 2018 Only 5906 5998 5855 7348 6785 6113 6185 6515 6439 7426 7107 7271 Forecas 2019 2019 t3- Forecast 2019 Forecas month 3-Month Forecas t Exp. Moving Weighted Exp. Smoothi Averag Moving Smoothing with e Average ng Trend 7056 7042 6507 6643 6587 6398 6625 6753 6268 6125 6755 6884 5815 5794 6469 6432 6201 6378 6312 6227 6393 6487 6128 6004 6421 6240 6377 6402 6136 6091 6420 6452 6115 6217 6230 6173 #N/A #NIA #NIA #NIA #NIA #NIA #N/A #NIA #NIA #N/A #N/A #NIA Season Adjusm ent Factors 0.90 0.91 0.89 1.12 1.03 0.93 0.94 0.99 0.98 1.13 1.08 1.11 SOOD January February March April May August September October November December June July Month -- -- -- 2018 Actual Total Sold Cases 2019 Actual Total Sold (Cases) Apply Seasonality Adjust Forecast Growth Rate (Ta Forecast Weights: YTD Aggregate Growth R No 3.007 207 0.09% Foreca MAD st MSE Accura MAPE 179 47224 2.87% 647 536722 10.56% 579 493531 9.43% 474 318880 7.92% 522 408027 8.72% 30% 507 M&M Sales Trends and Forecast (Cases) 9000 7500 7000 6500 6000 5500 5000 January February March April May June July August September October November December Manth -2018 Actual Total Sold (Cases) --- 2019 Forecast Growth over 2018 Only - 2019 Forecast 3 Month Weighted Moving Average - 2019 Forecast Exp. Smoothing with Trend 2019 Actual Total Sold cases) -- 2019 Forecast 3-month Moving Average --- 2019 Forecast Exp. Smoothing

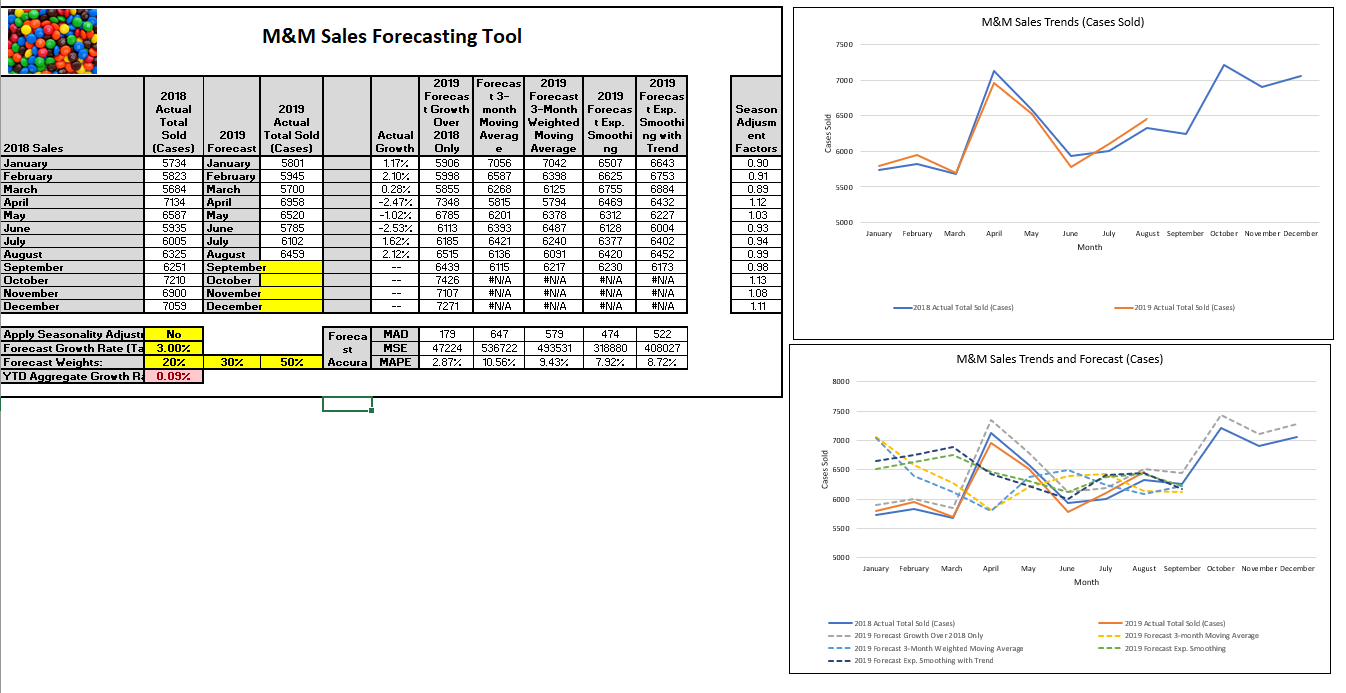
Step by Step Solution

There are 3 Steps involved in it

1 Expert Approved Answer
Step: 1 Unlock blur-text-image
Question Has Been Solved by an Expert!

Get step-by-step solutions from verified subject matter experts

Step: 2 Unlock
Step: 3 Unlock

Students Have Also Explored These Related General Management Questions!