

Question: Based on the Data Below is Uber's statistics show Uber is more Safe , the same, or less safe in the United States than with


Based on the Data Below is Uber's statistics show Uber is more Safe , the same, or less safe in the United States than with that of the totality of vehicle incidents in the US and Why?
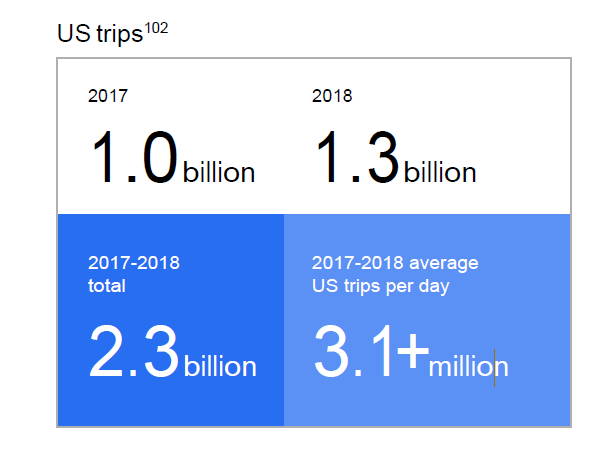


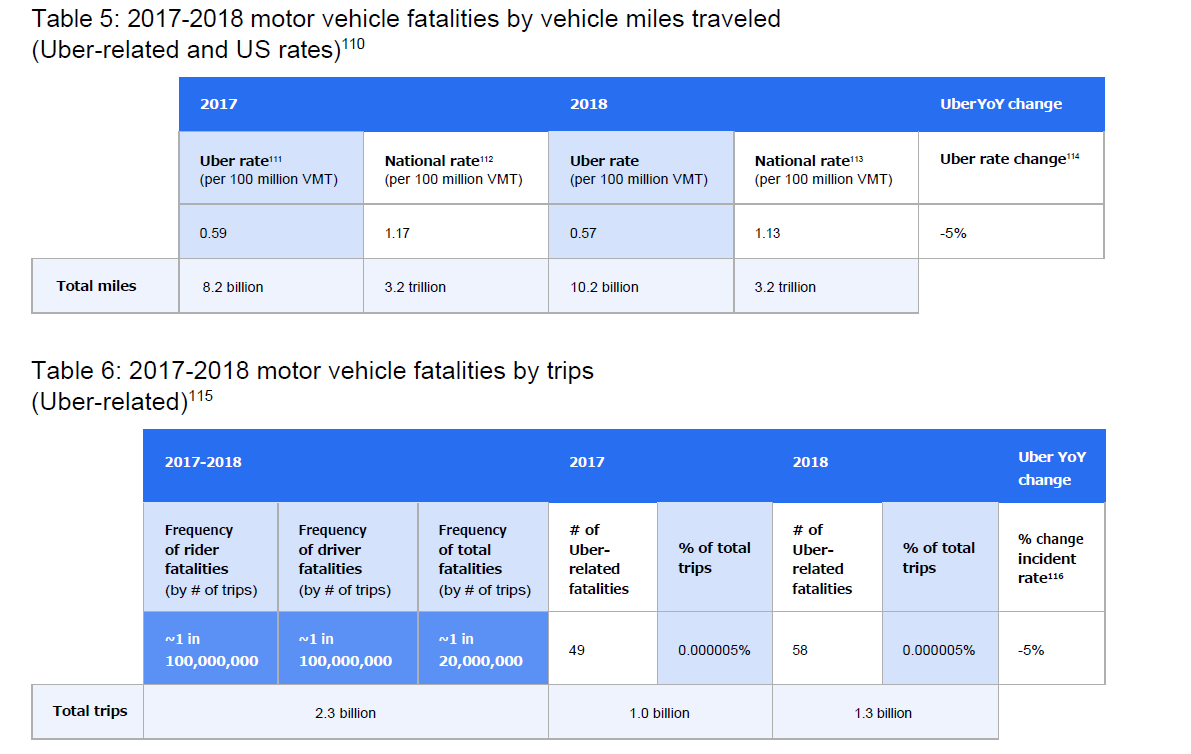
US trips 102 2017 2018 1.0 billion 1.3 billion 2017-2018 2017-2018 average total US trips per day 2.3 billion 3.1+ millionMotor vehicle fatalities In 2018 alone, 36,560 people lost their lives in motor vehicle fatalities in the US. 105 While national trends in traffic fatalities have decreased over recent years, 106 too many families are living with these losses.Table 5: 2017-2018 motor vehicle fatalities by vehicle miles traveled (Uber-related and US rates)110 2017 2018 Uber YoY change Uber rate1 11 National rate 112 Uber rate National rate113 Uber rate change114 (per 100 million VMT) (per 100 million VMT) (per 100 million VMT) (per 100 million VMT) 0.59 1.17 0.57 1.13 -5% Total miles 8.2 billion 3.2 trillion 10.2 billion 3.2 trillion Table 6: 2017-2018 motor vehicle fatalities by trips (Uber-related) 115 2017-2018 2017 2018 Uber YoY change Frequency Frequency Frequency # of # of of rider of driver of total Uber- % of total Uber- % of total % change fatalities incident fatalities fatalities related trips related trips rate116 (by # of trips) (by # of trips) (by # of trips) fatalities fatalities ~1 in w1 in ~1 in 49 0.000005% 58 0.000005% -5% 100,000,000 100,000,000 20,000,000 Total trips 2.3 billion 1.0 billion 1.3 billionFor the purposes of this report, we examine data from 2017 through 2018, a time frame in which an average of more than 3.1 million trips took place daily in the US. These figures provide an important backdrop to understanding the incident rates included in the Data insights chapter of this Safety Report
Step by Step Solution
There are 3 Steps involved in it

Get step-by-step solutions from verified subject matter experts