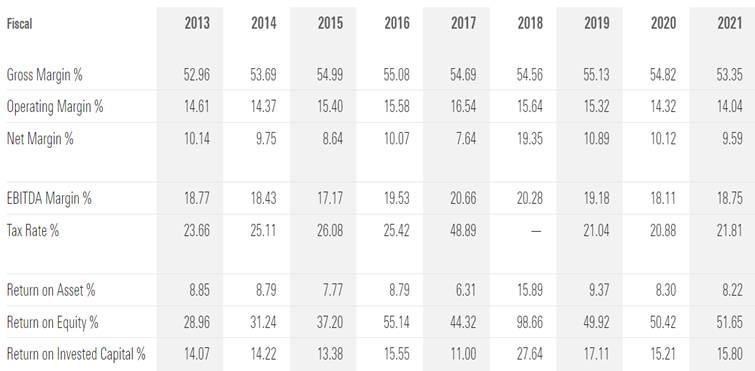
Question: Based on the data below, what can we interpret about PepsiCo's expense control? Fiscal 2013 2014 2015 2016 2017 2018 2019 2020 2021 Gross Margin

Based on the data below, what can we interpret about PepsiCo's expense control?

Based on the data below, what can we interpret
Fiscal 2013 2014 2015 2016 2017 2018 2019 2020 2021 Gross Margin % 52.96 53.69 54.99 55.08 54.69 54.56 55.13 54.82 53.35 Operating Margin % 14.61 14.37 15.40 15.58 16.54 15.64 15.32 14.32 14.04 Net Margin % 10.14 9.75 8.64 10.07 7.64 19.35 10.89 10.12 9.59 EBITDA Margin % 18.77 18.43 17.17 19.53 20.66 20.28 19.18 18.11 18.75 Tax Rate % 23.66 25.11 26.08 25.42 48.89 21.04 20.88 21.81 Return on Asset % 8.85 8.79 7.77 8.79 6.31 15.89 9.37 8.30 8.22 Return on Equity % 28.96 31.24 37.20 55.14 44.32 98.66 49.92 50.42 51.65 Return on Invested Capital % 14.07 14.22 13.38 15.55 11.00 27.64 17.11 15.21 15.80

Step by Step Solution

There are 3 Steps involved in it

1 Expert Approved Answer
Step: 1 Unlock blur-text-image
Question Has Been Solved by an Expert!

Get step-by-step solutions from verified subject matter experts

Step: 2 Unlock
Step: 3 Unlock

Students Have Also Explored These Related Finance Questions!