

Question: Based on the data given below, create a master curve at Tg (477 K) and identify the glassy, rubbery, and viscous fluid regions on your

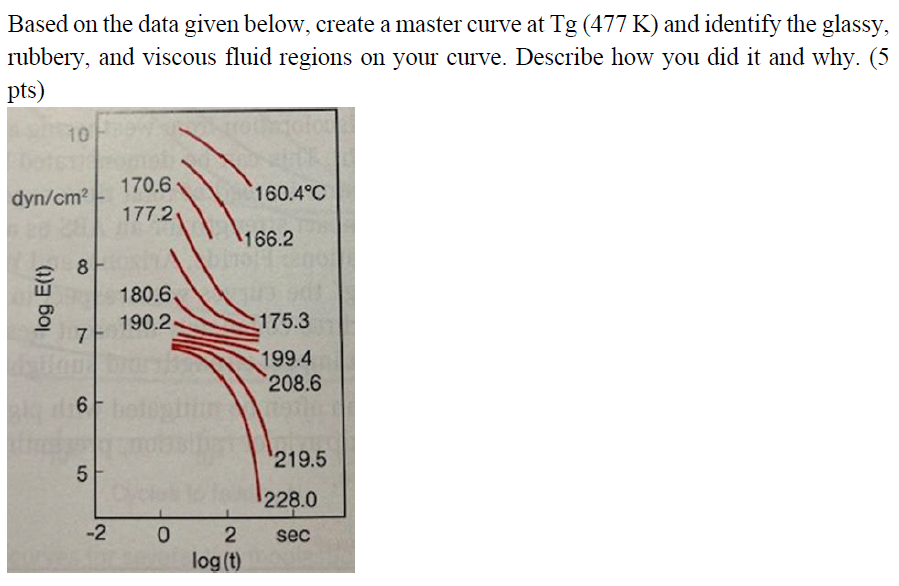
Based on the data given below, create a master curve at Tg (477 K) and identify the glassy, rubbery, and viscous fluid regions on your curve. Describe how you did it and why. (5 pts) 10 dyn/cm? 170.6 160.4 C 177.2 166.2 8 log E(t) 180.6 190.2. 175.3 7 199.4 208.6 6 `219.5 5 228.0 -2 0 2 sec log (t)
Step by Step Solution
There are 3 Steps involved in it
1 Expert Approved Answer
Step: 1 Unlock

Question Has Been Solved by an Expert!
Get step-by-step solutions from verified subject matter experts
Step: 2 Unlock
Step: 3 Unlock