

Question: Based on the data given does it appear to be linear? Explain the ff. association, if any, between the number of complaints per visit times
Based on the data given does it appear to be linear? Explain the ff.
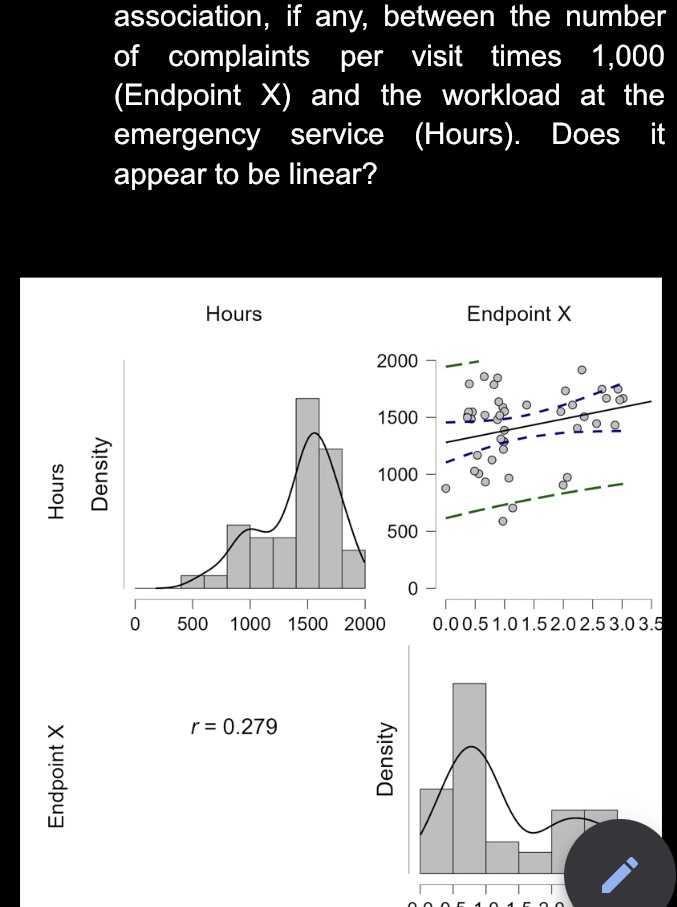
association, if any, between the number of complaints per visit times 1,000 (Endpoint X) and the workload at the emergency service (Hours). Does it appear to be linear? Hours Endpoint X 2000 08 - 50- 1500 opD' - Density 1000 Hours 500 0 0 500 1000 1500 2000 0.0 0.5 1.0 1.52.02.5 3.03.5 r = 0.279 Density Endpoint X
Step by Step Solution
There are 3 Steps involved in it
1 Expert Approved Answer
Step: 1 Unlock

Question Has Been Solved by an Expert!
Get step-by-step solutions from verified subject matter experts
Step: 2 Unlock
Step: 3 Unlock