

Question: Based on the data given in Question 9, what will be the The graph below is the plot of the total solidification time (in minutes)
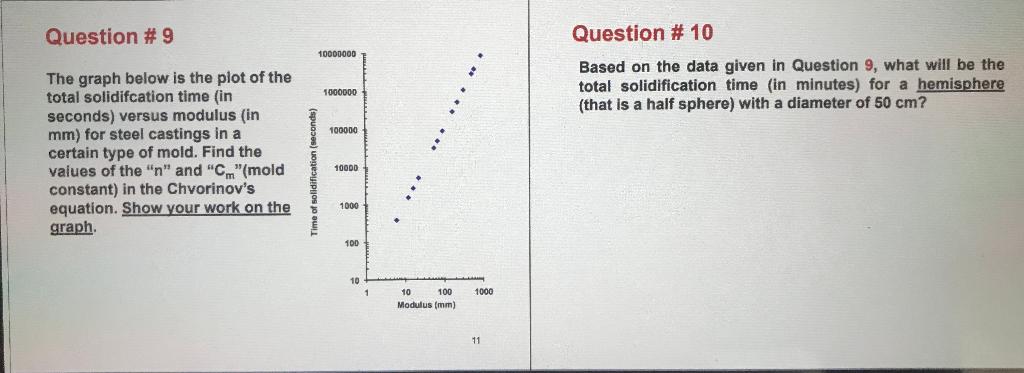
Based on the data given in Question 9, what will be the The graph below is the plot of the total solidification time (in minutes) for a hemisphere total solidifcation time (in (that is a half sphere) with a diameter of 50cm ? seconds) versus modulus (in mm ) for steel castings in a certain type of mold. Find the values of the " n " and " Cm "(mold constant) in the Chvorinov's equation. Show your work on the graph. Based on the data given in Question 9, what will be the The graph below is the plot of the total solidification time (in minutes) for a hemisphere total solidifcation time (in (that is a half sphere) with a diameter of 50cm ? seconds) versus modulus (in mm ) for steel castings in a certain type of mold. Find the values of the " n " and " Cm "(mold constant) in the Chvorinov's equation. Show your work on the graph
Step by Step Solution
There are 3 Steps involved in it

Get step-by-step solutions from verified subject matter experts