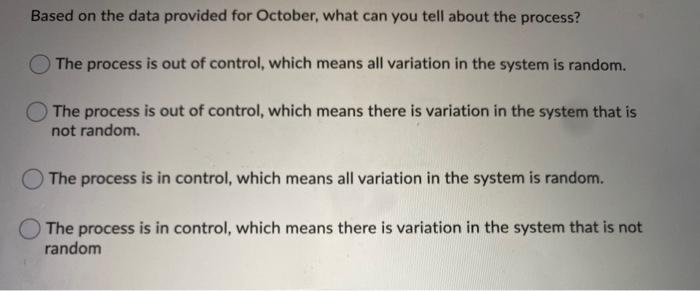
Question: Based on the data provided for October, what can you tell about the process? The process is out of control, which means all variation in

Based on the data provided for October, what can
Based on the data provided for October, what can you tell about the process? The process is out of control, which means all variation in the system is random. The process is out of control, which means there is variation in the system that is not random. The process is in control, which means all variation in the system is random. The process is in control, which means there is variation in the system that is not random Which of the following additional SPC charts could Sparrow Hotel use to evaluate the performance of their customer management system? Average time required for guest check-in: x-bar chart and R-chart Number of data entry errors per guest file: p-chart Average customer satisfaction score: C-chart Proportion of customers who log a complaint: c-chart Each A (finished product) requires 1 of component B and 2 of component C. Each B requires 2 of part D and 1 of part E; and each C requires 1 of part D and 1 of part F. If the demand for product A is 30 units, and there are 5 units of B on hand and 30 units of C, how many units of part D will be needed? 80 60 120 100 Sparrow Hotel is an upscale, 300-room hotel in Winnipeg, which strives to be recognized for extremely high customer service. For the past five years, the hotel has been using an ERP system with an automatic, express guest checkout capability. In September, the system was upgraded, and all existing employees received training on the new features on September 30. The hotel uses the number of incorrect bills as one of the service quality measures. An audit of 100 random bills is conducted every day. The audit result for the first ten days of October is shown below: Date 1 2 3 4 4 5 6 6 7 7 8 9 10 6 8 5 3 4 1 N 3 N 3 No. of incorrect bills (Optional spreadsheet for calculations) What type of SPC chart is best suited for the data presented above? p-chart c-chart x-bar chart and R-chart x-bar chart only For the past two years, the average number of incorrect bills has been 2.5% of the bills audited. If three sigma control limits are used, what is the upper control limit? 6.78% 7.18% 2.52% 9.36% Question 16 (1.5 points) Saved Listen If three sigma control limits are used, what is the lower control limit? 0% 8.12% 1.35% 2.50%

Step by Step Solution

There are 3 Steps involved in it

1 Expert Approved Answer
Step: 1 Unlock blur-text-image
Question Has Been Solved by an Expert!

Get step-by-step solutions from verified subject matter experts

Step: 2 Unlock
Step: 3 Unlock

Students Have Also Explored These Related General Management Questions!