

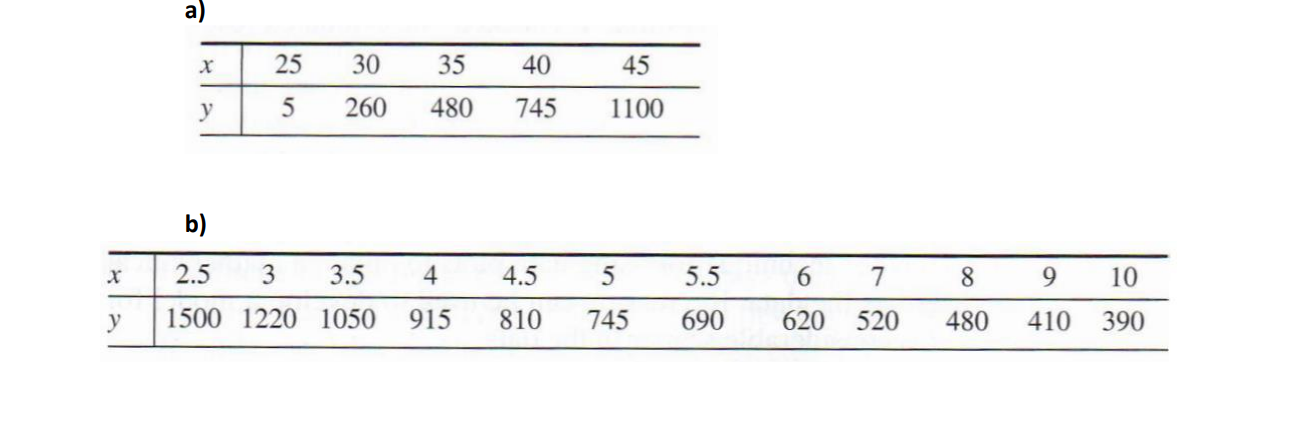
Question: Based on the data provided in the problems below, select the function y ( x ) y ( x ) that best represents each dataset
Based on the data provided in the problems below, select the function yxyx that best represents each dataset linear exponential, or power function
Plot the chosen function over the data points in MATLAB. Ensure proper labeling on the graphs, including names for the x and y axes and a title for each function in the graph.
Step by Step Solution
There are 3 Steps involved in it
1 Expert Approved Answer
Step: 1 Unlock

Question Has Been Solved by an Expert!
Get step-by-step solutions from verified subject matter experts
Step: 2 Unlock
Step: 3 Unlock