

Question: Based on the data shown below, calculate the regression line. 13.75 14.5 10.75 13.4 13.45 11.9 10.65 10.2 10.75 11.6 w [three decimal accuracy] [three

![accuracy] [three decimal accuracy] A regression was run to determine if there](https://s3.amazonaws.com/si.experts.images/answers/2024/06/6674dfebd1382_5316674dfebabfeb.jpg)


![watches 11.5 hours of TV can do. [one decimal accuracy] Determine if](https://s3.amazonaws.com/si.experts.images/answers/2024/06/6674dfefd27ac_5356674dfefa5e52.jpg)
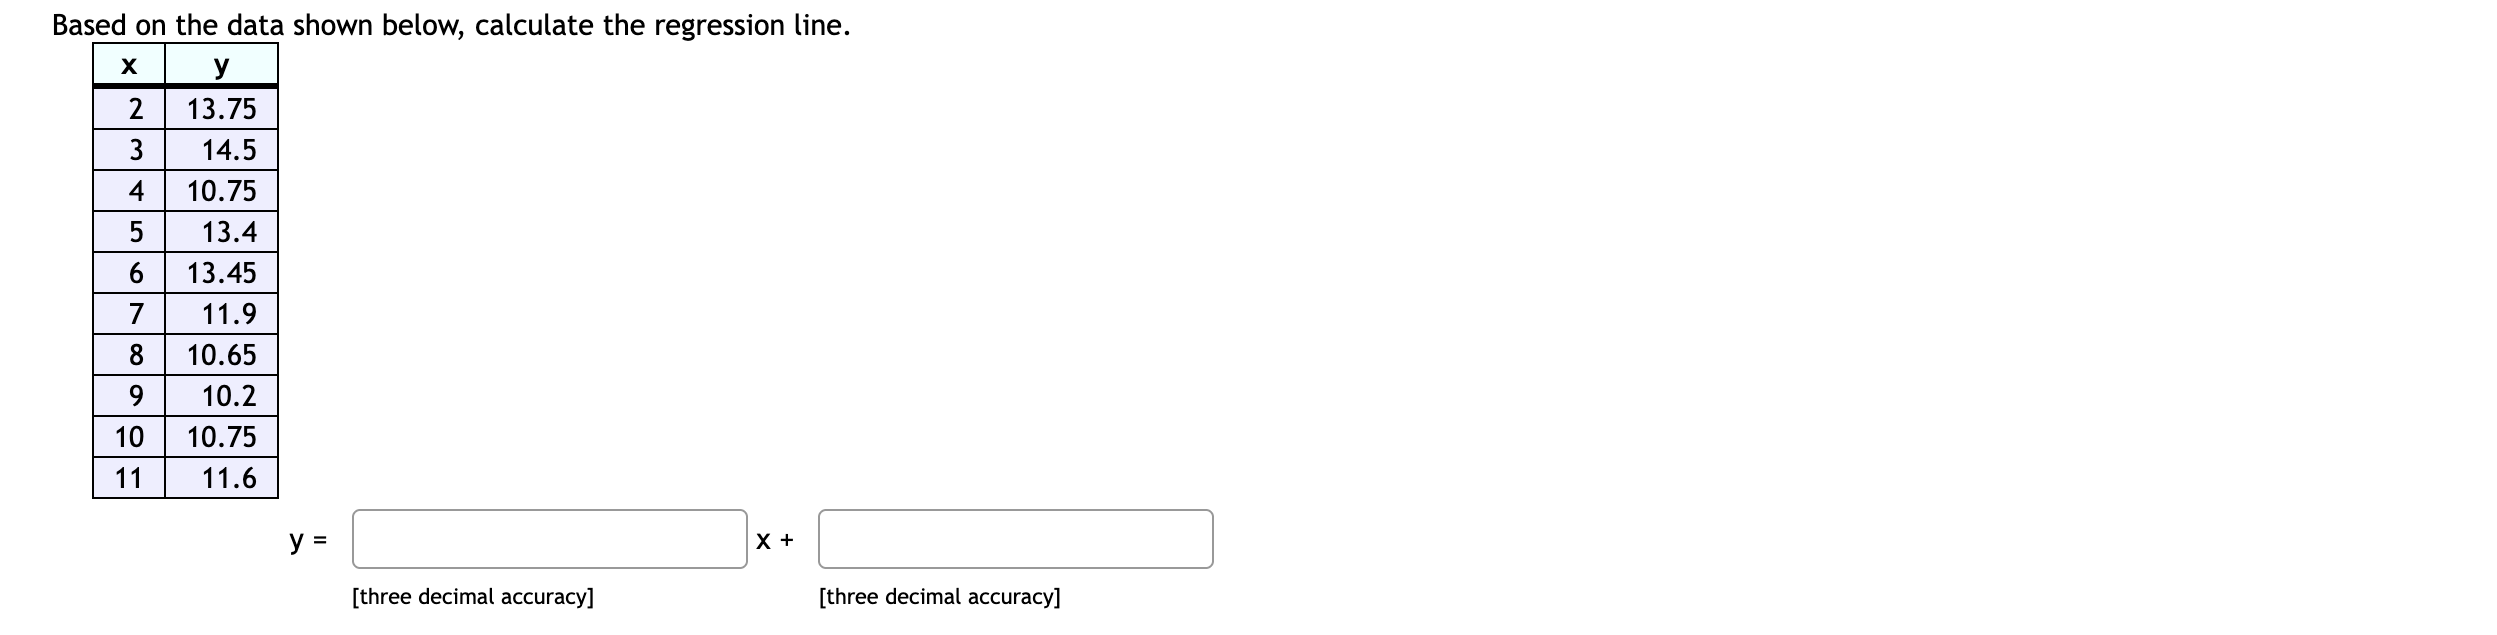
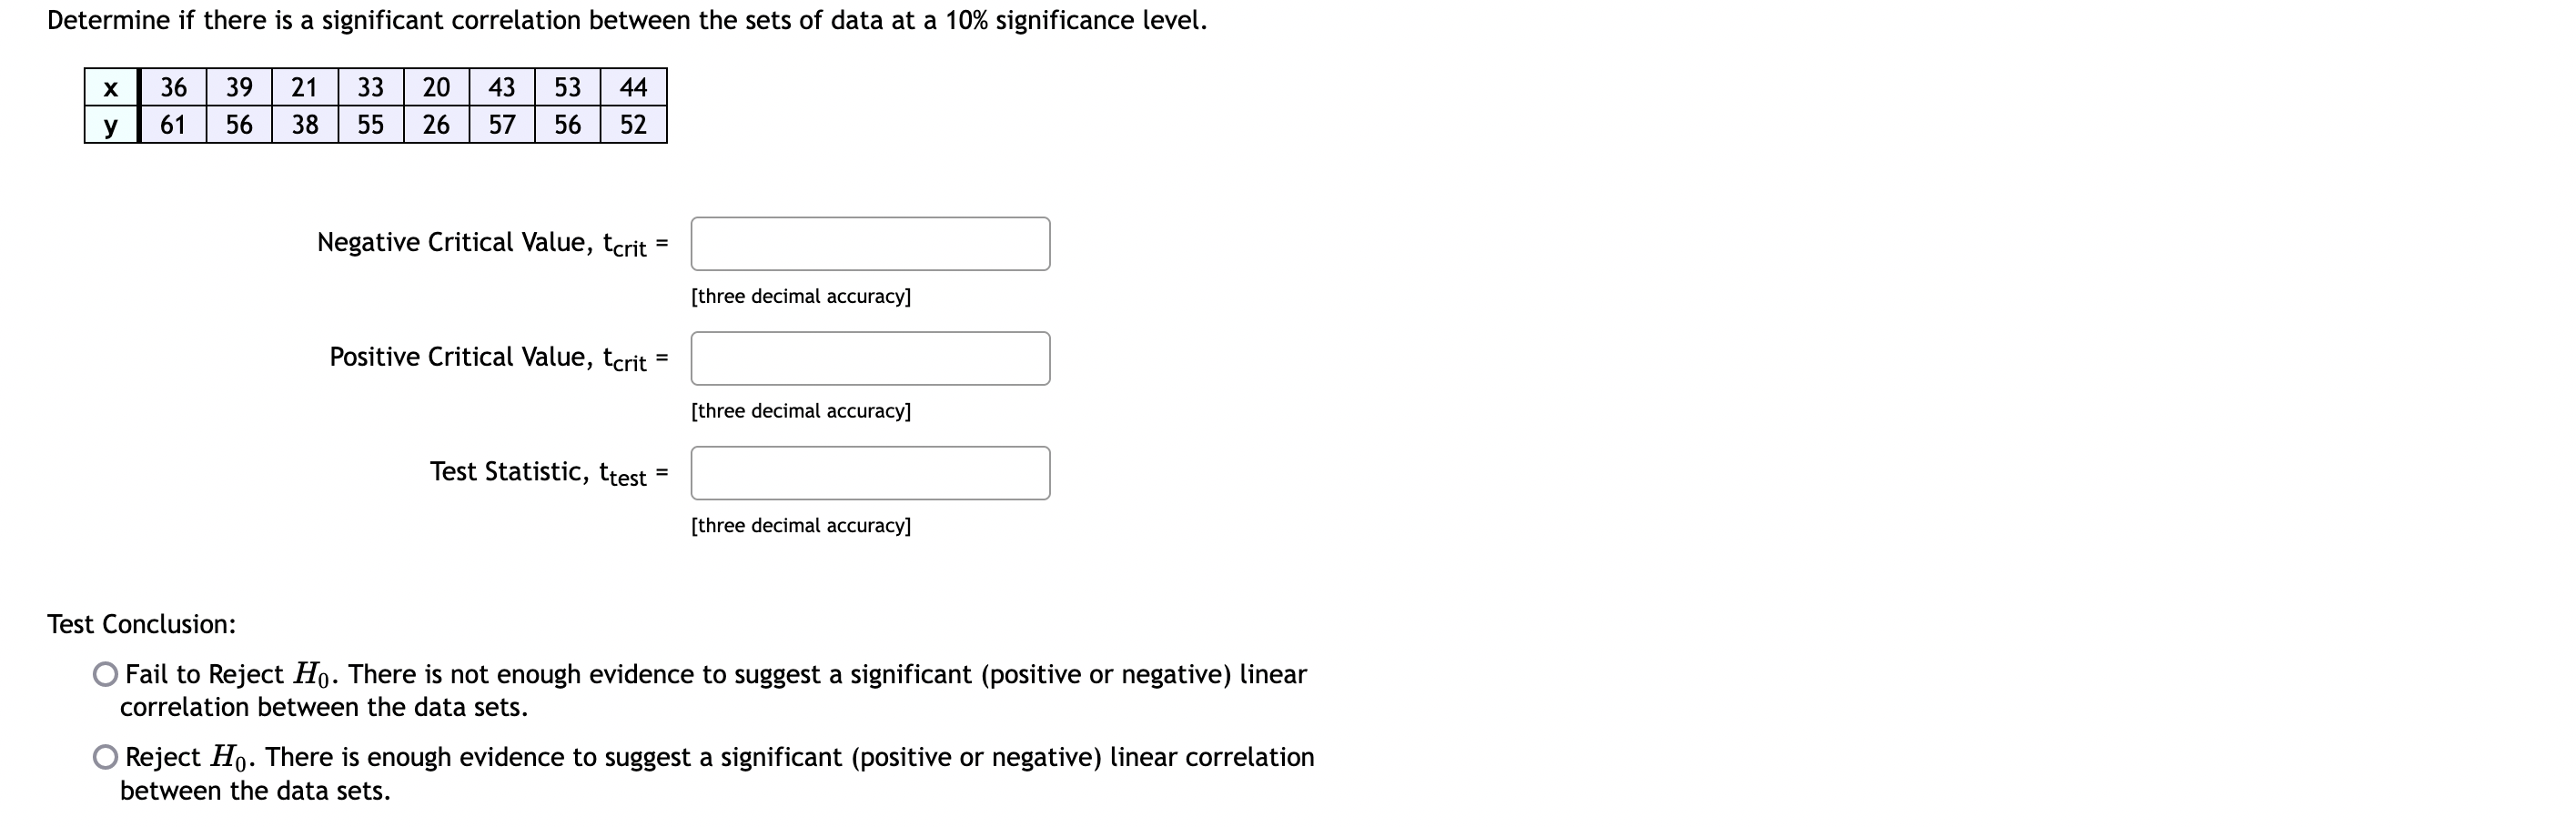
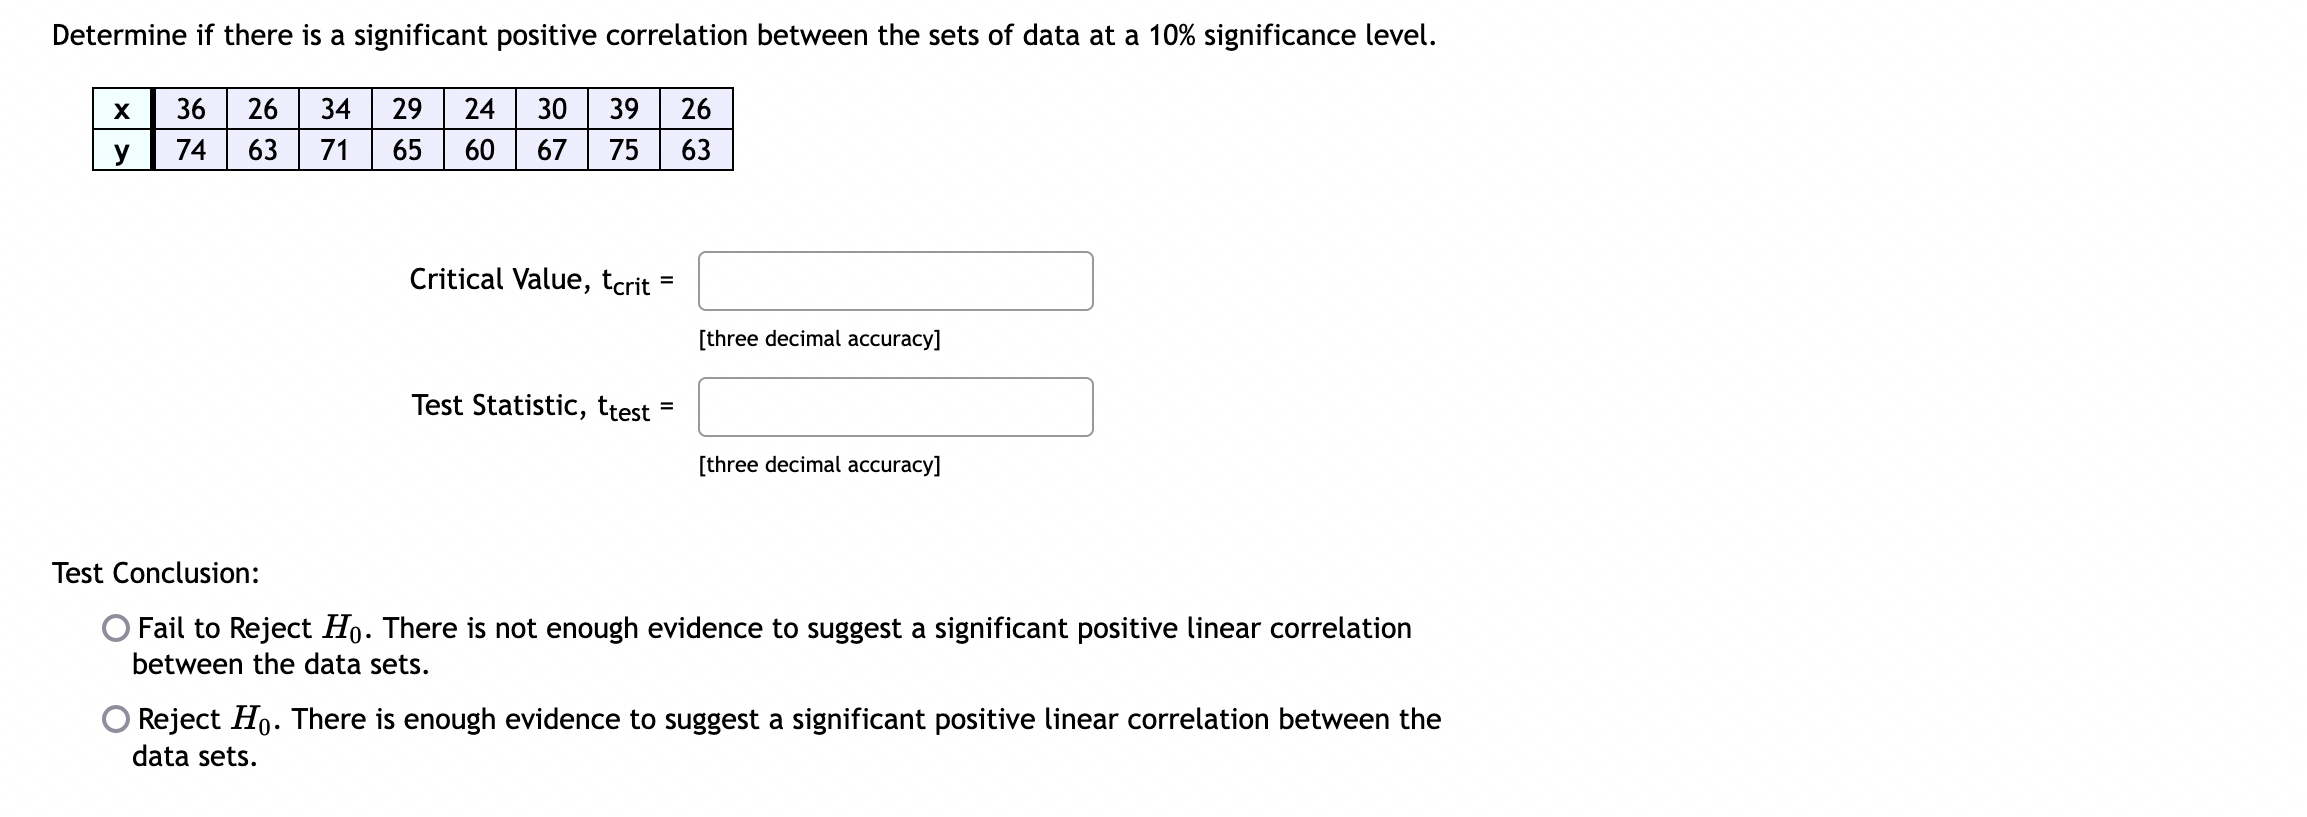
Based on the data shown below, calculate the regression line. 13.75 14.5 10.75 13.4 13.45 11.9 10.65 10.2 10.75 11.6 w [three decimal accuracy] [three decimal accuracy] A regression was run to determine if there is a relationship between hours of TV watched per day (x) and number of situps a person can do (y). The results of the regression were: y=ax+b a = -0.644 b = 21.671 r2 = 0.786769 r=0.887 Use this to predict the number of situps a person who watches 11.5 hours of TV can do. [one decimal accuracy] Determine if there is a significant positive correlation between the sets of data at a 10% significance level. X 36 26 34 29 24 30 39 26 74 63 71 65 60 67 75 63 Critical Value, tcrit = [three decimal accuracy] Test Statistic, ttest = [three decimal accuracy] Test Conclusion: O Fail to Reject Ho. There is not enough evidence to suggest a significant positive linear correlation between the data sets. O Reject Ho. There is enough evidence to suggest a significant positive linear correlation between the data sets.Determine if there is a significant correlation between the sets of data at a 10% significance level. 53 44 56 52 y 6156 38 55 26 57 x[36'39 21 33 20 43 Negative Critical Value, tcm = :] [three decimal accuracy] Positive Critical Value, tcm = :] [three decimal accuracy] Testsmisc'w :] [three decimal accuracy] Test Conclusion: 0 Fail to Reject Ho. There is not enough evidence to suggest a significant (positive or negative) linear correlation between the data sets. 0 Reject Ho. There is enough evidence to suggest a significant (positive or negative) linear correlation between the data sets
Step by Step Solution
There are 3 Steps involved in it

Get step-by-step solutions from verified subject matter experts