

Question: Based on the data shown below, calculate the regression line (each value to at least two decimal places) Suppose you were to collect data for
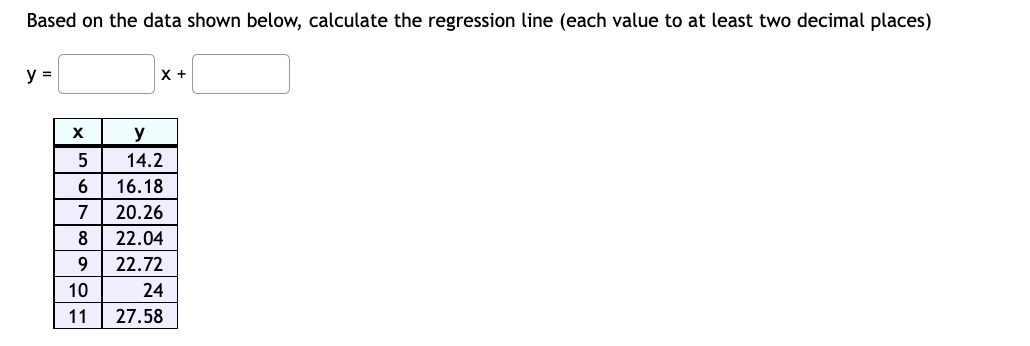
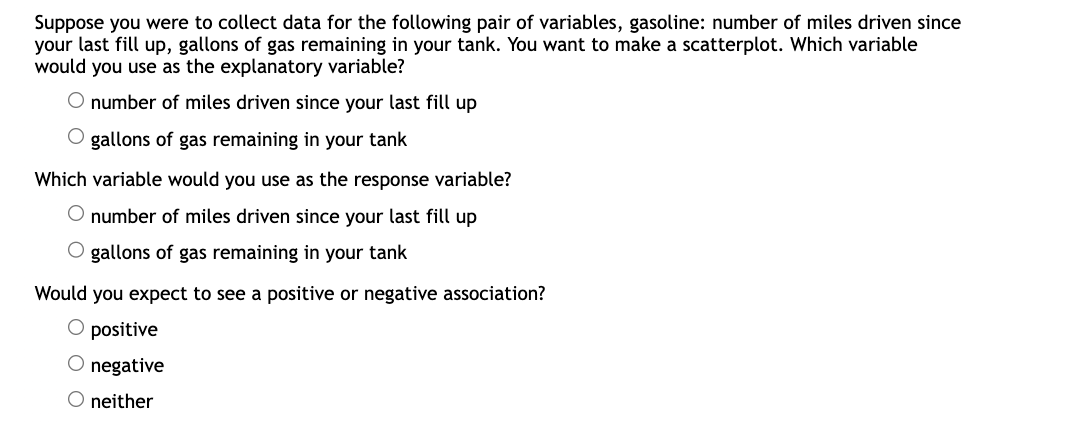
Based on the data shown below, calculate the regression line (each value to at least two decimal places) Suppose you were to collect data for the following pair of variables, gasoline: number of miles driven since your last fill up, gallons of gas remaining in your tank. You want to make a scatterplot. Which variable would you use as the explanatory variable? 0 number of miles driven since your last fill up 0 gallons of gas remaining in your tank Which variable would you use as the response variable? 0 number of miles driven since your last fill up 0 gallons of gas remaining in your tank Would you expect to see a positive or negative association? 0 positive 0 negative 0 neither
Step by Step Solution
There are 3 Steps involved in it

Get step-by-step solutions from verified subject matter experts