

Question: Based on the data shown below, calculate the regression line (each value to two decimal places) y = X 5 678 9 PENGH56 10
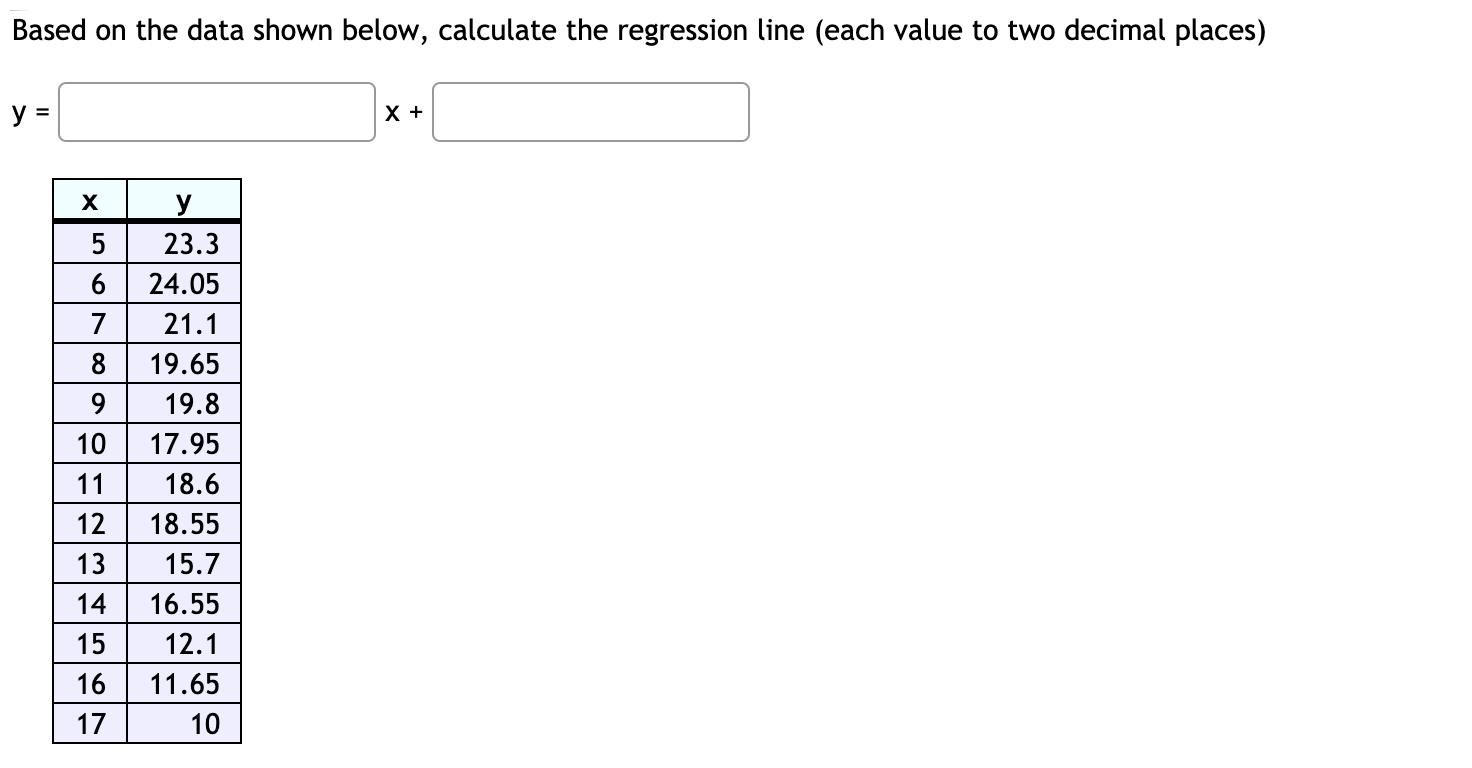
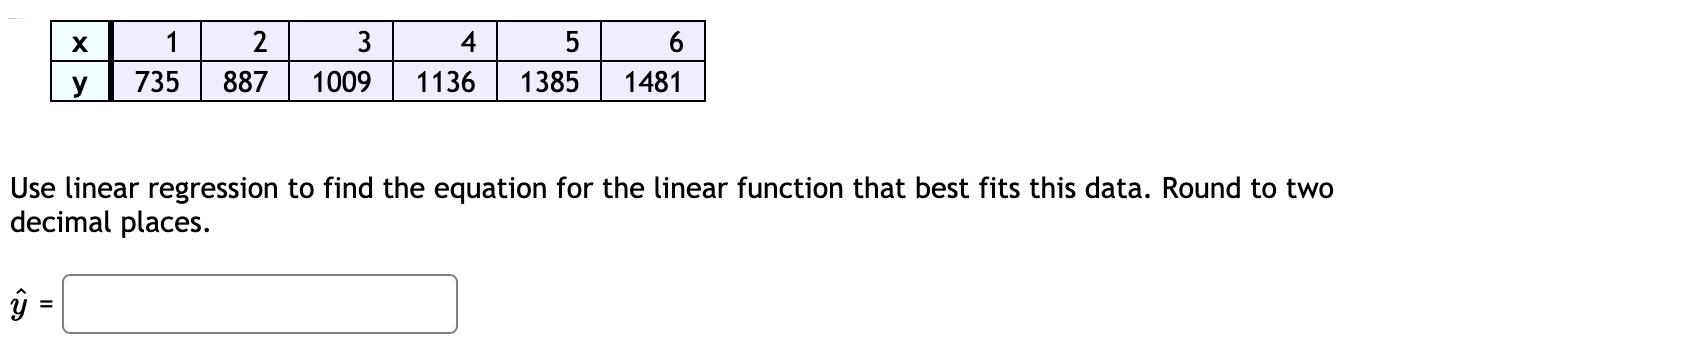
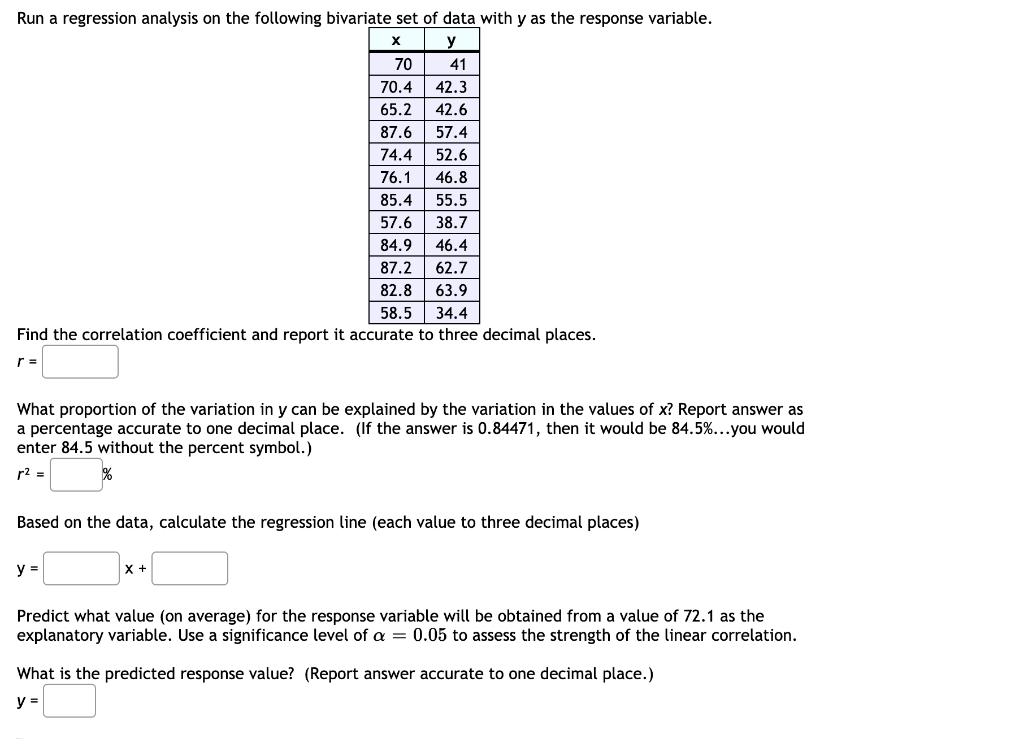
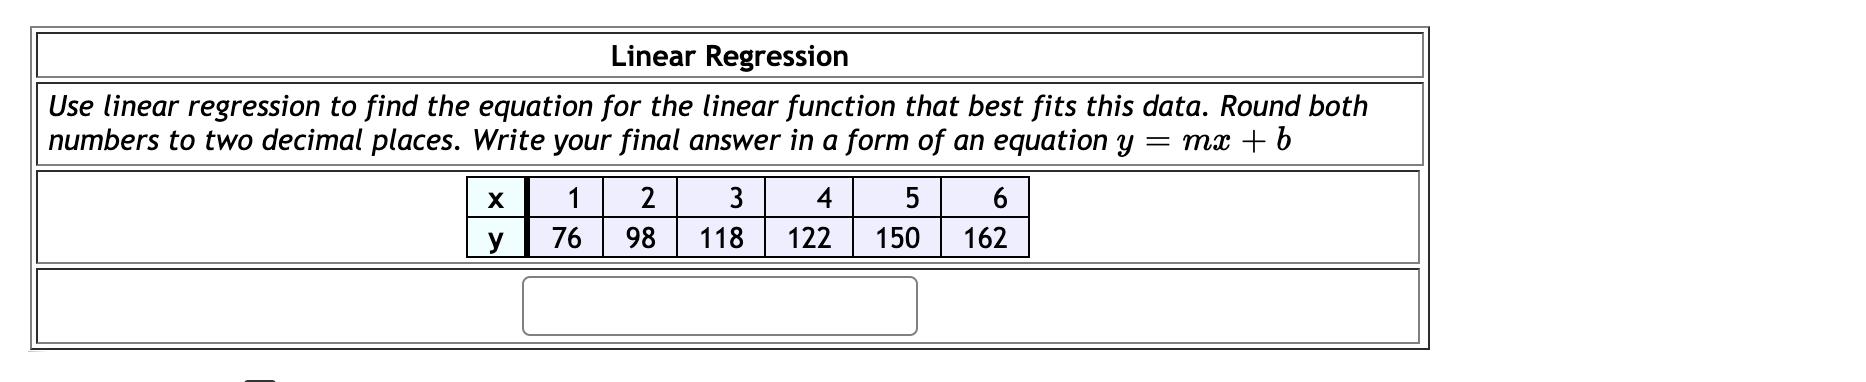
Based on the data shown below, calculate the regression line (each value to two decimal places) y = X 5 678 9 PENGH56 10 11 12 13 14 15 16 17 y 23.3 24.05 21.1 19.65 19.8 17.95 18.6 18.55 15.7 16.55 12.1 11.65 10 X + X y 1 2 3 735 887 1009 4 5 1136 1385 1481 Use linear regression to find the equation for the linear function that best fits this data. Round to two decimal places. Run a regression analysis on the following bivariate set of data with y as the response variable. X y 46.4 62.7 63.9 34.4 Find the correlation coefficient and report it accurate to three decimal places. r= 70 41 70.4 42.3 65.2 42.6 87.6 57.4 74.4 52.6 76.1 46.8 85.4 55.5 57.6 38.7 84.9 87.2 82.8 58.5 What proportion of the variation in y can be explained by the variation in the values of x? Report answer as a percentage accurate to one decimal place. (If the answer is 0.84471, then it would be 84.5%... you would enter 84.5 without the percent symbol.) r = Based on the data, calculate the regression line (each value to three decimal places) y = X + Predict what value (on average) for the response variable will be obtained from a value of 72.1 as the explanatory variable. Use a significance level of a = 0.05 to assess the strength of the linear correlation. What is the predicted response value? (Report answer accurate to one decimal place.) y = Linear Regression Use linear regression to find the equation for the linear function that best fits this data. Round both numbers to two decimal places. Write your final answer in a form of an equation y = mx + b X y 1 2 76 98 3 118 4 5 122 150 6 162
Step by Step Solution
3.59 Rating (145 Votes )
There are 3 Steps involved in it
Solution1 use lm fucnti... View full answer

Get step-by-step solutions from verified subject matter experts