

Question: Based on the dataset information given above, please answer the following questions. You are required to perform the following tasks using R Studio. Please provide
Based on the dataset information given above, please answer the following questions. You are required to perform the following tasks using R Studio. Please provide the script, and screenshot of the output.
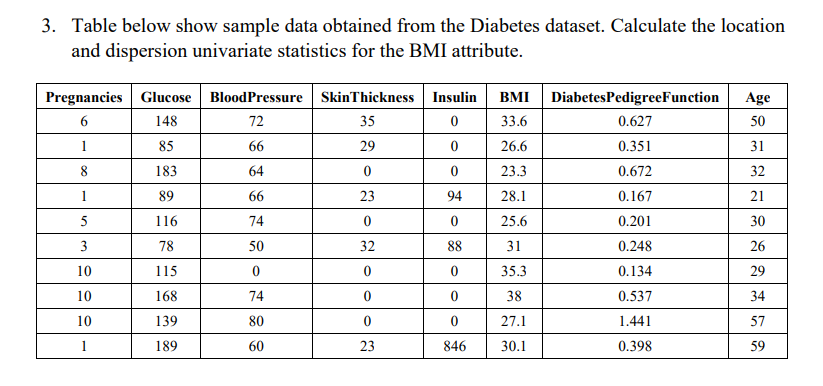
Q If you want to see the st Quartile, Median and rd Quartile of DiabetesPedigreeFunction, which plot is suitable to visualize these three information? Visualize the plot with appropriate header and label.Table below show sample data obtained from the Diabetes dataset. Calculate the location
and dispersion univariate statistics for the BMI attribute.
Step by Step Solution
There are 3 Steps involved in it
1 Expert Approved Answer
Step: 1 Unlock

Question Has Been Solved by an Expert!
Get step-by-step solutions from verified subject matter experts
Step: 2 Unlock
Step: 3 Unlock