

Question: Based on the Estimates in Exhibit 17 (this is the Management Scenario), and Exhibit 18 (the Market Scenario), calculate the Free Cash Flows (FCF) for
- Based on the Estimates in Exhibit 17 (this is the Management Scenario), and Exhibit 18 (the Market Scenario), calculate the Free Cash Flows (FCF) for years 2010 to 2015.
FCF = NOPAT + Depreciation&Amortization - Capex Investment in NWC
In DCF models, NWC (Net Working Capital) does not include Cash in computing Current Assets, and also excludes any Interest-Bearing Debt (such as Current Portion of Long-Term Debt) in calculating Current Liabilities.
You will have to estimate the Capex needs in future. You may assume that Capex is a fixed %-age of Sales. For 2009, the information on Capex is given in the Cash-Flow Statement (Exhibit 8c).
Similarly, you may assume that NWC is a fixed %-age of Sales. This will give you the increase in NWC from year to year.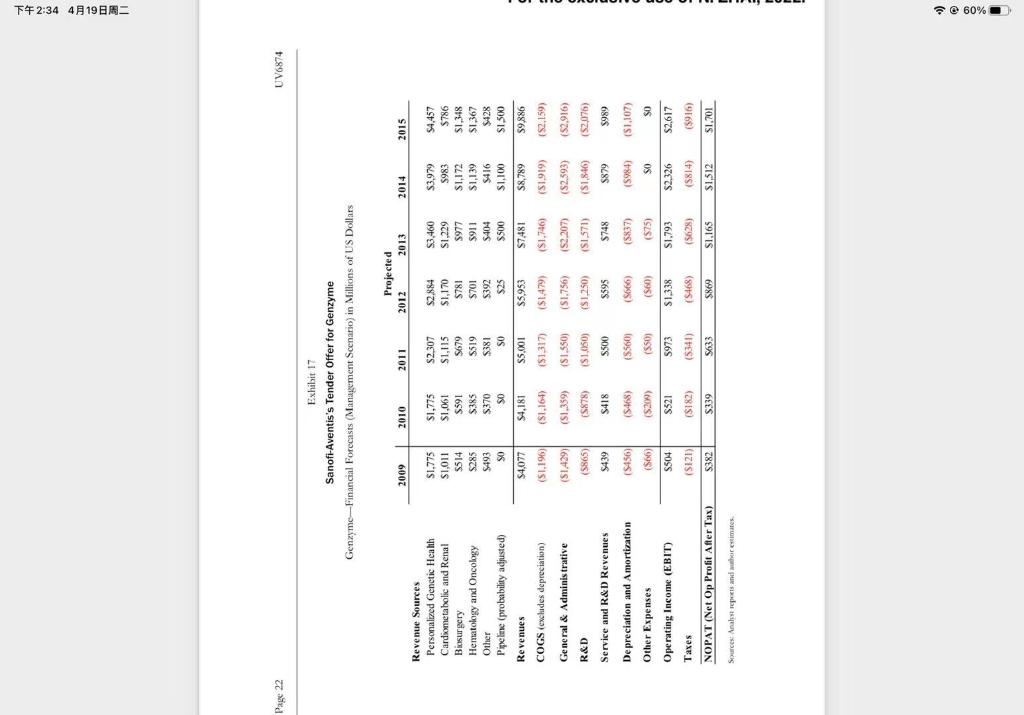
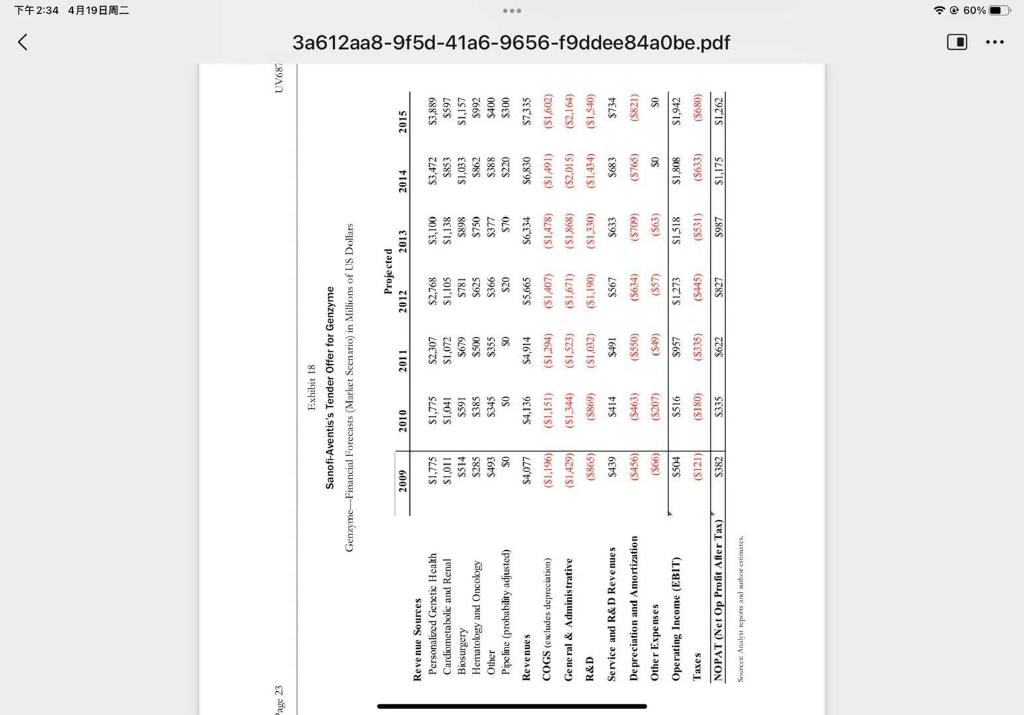
2:34 419 Page 22 UV6874 Exhibit 17 Sanofi-Aventis's Tender Offer for Genzyme Genzyme-Financial Forecasts (Management Scenario) in Millions of US Dollars Projected 2012 2013 2009 2010 2011 2014 2015 Revenue Sources Personalized Genetic Health Cardiometabolic and Renal Biosurgery Hematology and Oncology Other Pipeline (probability adjusted) S1.775 $1,011 5514 $285 5493 SO $1,775 $1,061 $591 $385 $370 SO $2,307 $1,115 S679 S519 5381 SO $2,884 S1,170 781 $701 $392 $25 S3,460 S1,229 5977 $911 $404 S500 $3.979 5983 SI, 172 S1,139 5416 SI,100 S4.457 $786 S1,348 S1,367 $428 SI 500 Revenues $4,077 S4,181 S5,001 $5,953 S7481 58,789 $9,886 COGS (excludes depreciation) (S1,196) (S1,164) 151317) (51.479) (S1.746) (S1919) (82,159) General & Administrative (S1,4293 (S1,359) (S1.550) (52,207) (S2.593) R&D (5865) (S878) ($1,050) (S1.756) ($1,250) 5595 (51,846) (S1,571) $748 (52,916) (52,076) $989 Service and R&D Revenues S439 S418 S500 5879 Depreciation and Amortization (5468) (5560) (5666) (5837) (S1.107) (S456) (566) Other Expenses (S200) (575) (550) $973 SO (5984) $0 $2.326 (560) S1,338 Operating Income (EBIT) 5504 S521 S1.793 52.617 Taxes (S121 (S182) (5341) (S468) (5628) (5814) (5916) NOPAT (Net Op Profit After Tax) $339 5633 5869 S1,165 $1,512 S1,701 Sources: Analostrepts and estimates i > T42:34 419 Page 23 UV681 Exhibit 18 Sanofi-Aventis's Tender Offer for Genzyme Genzyme-Financial Forecasts (Market Scenario) in Millions of US Dollars Projected 2012 2013 2009 2010 2011 2014 2015 S3,100 S1,138 $3,889 $597 Revenue Sources Personalized Genetic Health Cardiometabolic and Renal Biosurgery Hematology and Oncology Other Pipeline (probability adjusted) Revenues COGS (excludes depreciation) S1,775 $1,011 5514 S285 $493 SO $1,775 $1,041 5591 $385 8345 SO $2,307 S1,072 5679 S500 $355 SO $2,768 $1,105 S781 S625 S366 S20 $3,472 5853 $1,0 5862 $388 $220 $750 $377 $70 5992 $400 $300 3a612aa8-9f5d-41a6-9656-f9ddee84aObe.pdf $4,077 54.136 S4,914 S6,334 S6,830 S5,665 (S1407) S7.335 (S1,602) (81,196) (51.294) (51,478) General & Administrative (SI.ISI) (51,344) (5869) (51 868) (51.429) (5865) (52,164) (51491) (52,015) ($1,434) (51,523) (51,032) $491 R&D (51,671) (S1.190) $567 (S1,330) (S1.540) $734 S439 $414 $633 5683 (S550) (5765) (5821) Service and R&D Revenues Depreciation and Amortization Other Expenses Operating Income (EBIT) (S450) (566) 5504 (S463) (S207) (5709) (563) SO SO (549) $957 (5634) (557) $1.273 (5545) S516 S1,518 $1.808 S1,942 Taxes (S121) ($180) (5335) (5531) (5680) (5633) $1,175 NOPAT (Net Op Profit After Tax) $382 $335 5622 5827 $987 S1,262 Set Analyst reports and to estimates 2:34 419 Page 22 UV6874 Exhibit 17 Sanofi-Aventis's Tender Offer for Genzyme Genzyme-Financial Forecasts (Management Scenario) in Millions of US Dollars Projected 2012 2013 2009 2010 2011 2014 2015 Revenue Sources Personalized Genetic Health Cardiometabolic and Renal Biosurgery Hematology and Oncology Other Pipeline (probability adjusted) S1.775 $1,011 5514 $285 5493 SO $1,775 $1,061 $591 $385 $370 SO $2,307 $1,115 S679 S519 5381 SO $2,884 S1,170 781 $701 $392 $25 S3,460 S1,229 5977 $911 $404 S500 $3.979 5983 SI, 172 S1,139 5416 SI,100 S4.457 $786 S1,348 S1,367 $428 SI 500 Revenues $4,077 S4,181 S5,001 $5,953 S7481 58,789 $9,886 COGS (excludes depreciation) (S1,196) (S1,164) 151317) (51.479) (S1.746) (S1919) (82,159) General & Administrative (S1,4293 (S1,359) (S1.550) (52,207) (S2.593) R&D (5865) (S878) ($1,050) (S1.756) ($1,250) 5595 (51,846) (S1,571) $748 (52,916) (52,076) $989 Service and R&D Revenues S439 S418 S500 5879 Depreciation and Amortization (5468) (5560) (5666) (5837) (S1.107) (S456) (566) Other Expenses (S200) (575) (550) $973 SO (5984) $0 $2.326 (560) S1,338 Operating Income (EBIT) 5504 S521 S1.793 52.617 Taxes (S121 (S182) (5341) (S468) (5628) (5814) (5916) NOPAT (Net Op Profit After Tax) $339 5633 5869 S1,165 $1,512 S1,701 Sources: Analostrepts and estimates i > T42:34 419 Page 23 UV681 Exhibit 18 Sanofi-Aventis's Tender Offer for Genzyme Genzyme-Financial Forecasts (Market Scenario) in Millions of US Dollars Projected 2012 2013 2009 2010 2011 2014 2015 S3,100 S1,138 $3,889 $597 Revenue Sources Personalized Genetic Health Cardiometabolic and Renal Biosurgery Hematology and Oncology Other Pipeline (probability adjusted) Revenues COGS (excludes depreciation) S1,775 $1,011 5514 S285 $493 SO $1,775 $1,041 5591 $385 8345 SO $2,307 S1,072 5679 S500 $355 SO $2,768 $1,105 S781 S625 S366 S20 $3,472 5853 $1,0 5862 $388 $220 $750 $377 $70 5992 $400 $300 3a612aa8-9f5d-41a6-9656-f9ddee84aObe.pdf $4,077 54.136 S4,914 S6,334 S6,830 S5,665 (S1407) S7.335 (S1,602) (81,196) (51.294) (51,478) General & Administrative (SI.ISI) (51,344) (5869) (51 868) (51.429) (5865) (52,164) (51491) (52,015) ($1,434) (51,523) (51,032) $491 R&D (51,671) (S1.190) $567 (S1,330) (S1.540) $734 S439 $414 $633 5683 (S550) (5765) (5821) Service and R&D Revenues Depreciation and Amortization Other Expenses Operating Income (EBIT) (S450) (566) 5504 (S463) (S207) (5709) (563) SO SO (549) $957 (5634) (557) $1.273 (5545) S516 S1,518 $1.808 S1,942 Taxes (S121) ($180) (5335) (5531) (5680) (5633) $1,175 NOPAT (Net Op Profit After Tax) $382 $335 5622 5827 $987 S1,262 Set Analyst reports and to estimates
Step by Step Solution
There are 3 Steps involved in it

Get step-by-step solutions from verified subject matter experts