

Question: Based on the findings shown in Table 3: Looking at the 95% confidence interval for the estimated unadjusted mean BMI between group difference in change
Based on the findings shown in Table 3: Looking at the 95% confidence interval for the estimated unadjusted mean BMI "between group difference in change score", do you think the estimated difference in change score (-1.1 kg/m2) was a statistically significant change?
Please circle one of the following options:YesNoNotspecified
Please explain your answer:
?
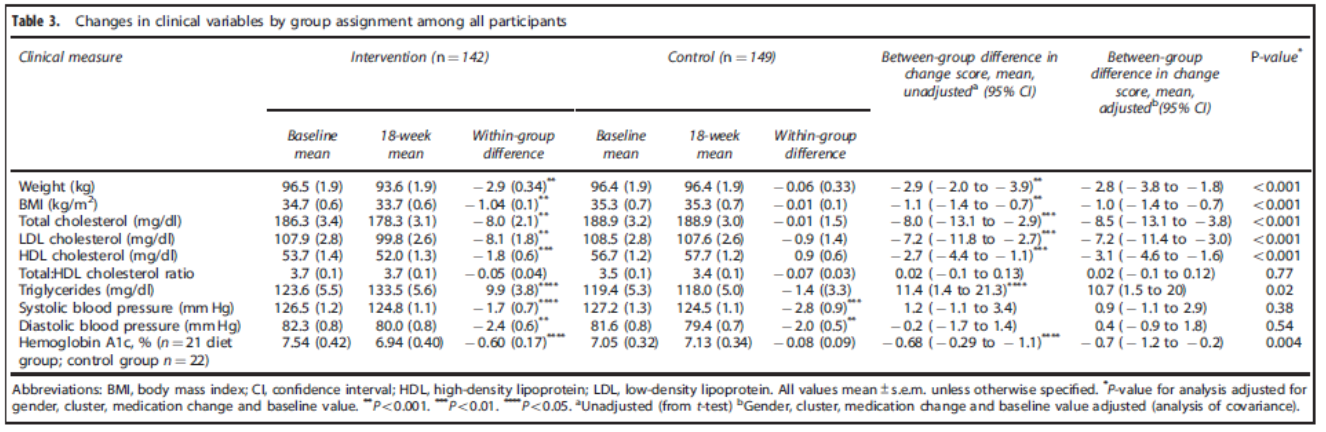
Table 3. Changes in clinical variables by group assignment among all participants Clinical measure Intervention (n = 142) Control (n = 149) Between-group difference in Between-group P-value change score, mean, difference in change unadjusted (95% C) score, mean, adjusted (95% CI) Baseline 18-week Within-group Baseline 18-week Within-group mean mean difference mean mean difference Weight (kg) 96.5 (1.9) 93.6 (1.9) -2.9 (0.34)" 96.4 (1.9) 96.4 (1.9) - 0.06 (0.33) -2.9 (-2.0 to - 3.9)" -28 (- 3.8 to - 1.8)
Step by Step Solution
There are 3 Steps involved in it

Get step-by-step solutions from verified subject matter experts