

Question: Based on the following chart, please calculate the expected return, the variance, and standard deviation if your portfolio is invested 25% in Fund A, 45%
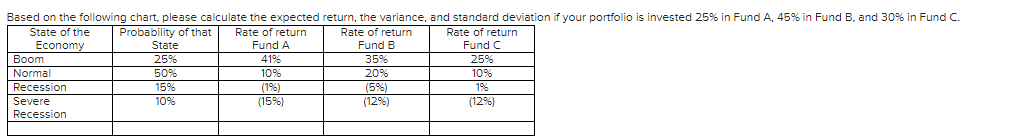
Based on the following chart, please calculate the expected return, the variance, and standard deviation if your portfolio is invested 25% in Fund A, 45% in Fund B, and 30% in Fund C. \begin{tabular}{|l|c|c|c|c|} \hline \multicolumn{1}{|c|}{ State of the Economy } & Probability of that State & Rate of return Fund A & Rate of return Fund B & Rate of return Fund C \\ \hline Boom & 25% & 41% & 35% & 25% \\ \hline Normal & 50% & 10% & 20% & 10% \\ \hline Recession & 15% & (196) & (5%) & 1% \\ \hline Severe Recession & 10% & (15%) & (12%) & (12%) \\ \hline & & & & \\ \hline \end{tabular}
Step by Step Solution
There are 3 Steps involved in it
1 Expert Approved Answer
Step: 1 Unlock

Question Has Been Solved by an Expert!
Get step-by-step solutions from verified subject matter experts
Step: 2 Unlock
Step: 3 Unlock