

Question: Based on the following data, determine whether retailing industry is margin dominant or turnover dominant? Given the below mentioned data, which of the sources of
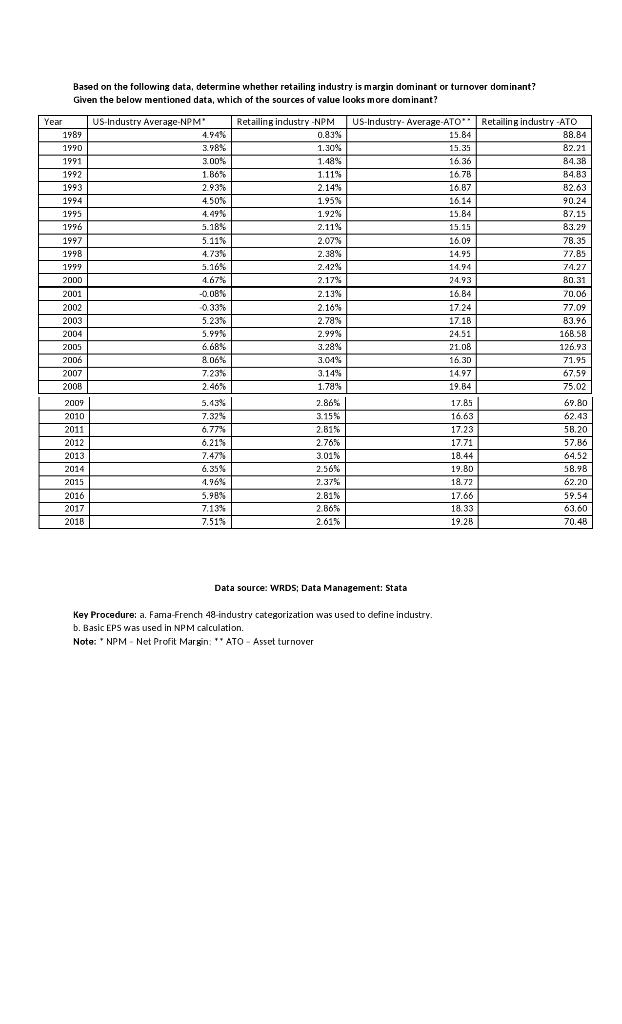
Based on the following data, determine whether retailing industry is margin dominant or turnover dominant? Given the below mentioned data, which of the sources of value looks more dominant? , ? Year US-Industry Average-NPM Retailing industry NPM US-Industry- Average-ATO Retailing industry-ATO 1989 4.94% 0.83% 15.84 88.84 1990 3.98% 1.30% 15.35 82.21 1991 3.00% 1.48% 16.36 84.38 1992 1.86% 1.11% 16.78 B4.83 1993 2.93% 2.14% 16.87 82.63 1994 4.50% 1.95% 16.14 90.24 1995 4.49% 1.92% 15.84 87.15 1996 5.18% 2.11% 15.15 83.29 1997 5.11% 2.07% 16.09 78.35 1998 4.73% 2.38% 14.95 77.85 1772 5.16% 2.42% 11.94 74.27 2000 4.67% 2.17% 24.93 80.31 2001 -0.08% 2.13% 16.14 70.06 2002 0.33% 2.16% 17 24 77.09 2003 5.23% 2.78% 17.18 83.96 2004 5.99% 2.99% 24.51 16B.58 2005 6.68% 3.28% 21.08 126.93 2006 8.06% 3.041% 16.30 71.95 2007 7.23% 3.14% 14.97 67.59 2008 2.46% 1.78% 19.B4 75.02 2009 5.43% 2.86% 17.85 67.80 2010 7.32% 3.15% 16.63 62.43 2011 6.77% 2.81% 17.23 58.20 2012 6.21% 2.76% 17.71 57.86 2013 7.47% 3.01% 18.44 64.52 2014 6.35% 2.56% 19.80 58.98 2015 1.96% 2.375 18.72 62.20 2016 5.98% 2.81% 17.66 59.54 2017 7.13% 2365 18.33 63.60 2018 7.51% 2.61% 19.26 70.48 Data source: WRDS; Data Management: Stata Key Procedure:a. Fama French 48-industry categorization was used to define industry. b. Basic EPS was used in NPM calculation. Note: NPM-Net Profit margin: "ATO - Asset turnover Based on the following data, determine whether retailing industry is margin dominant or turnover dominant? Given the below mentioned data, which of the sources of value looks more dominant? , ? Year US-Industry Average-NPM Retailing industry NPM US-Industry- Average-ATO Retailing industry-ATO 1989 4.94% 0.83% 15.84 88.84 1990 3.98% 1.30% 15.35 82.21 1991 3.00% 1.48% 16.36 84.38 1992 1.86% 1.11% 16.78 B4.83 1993 2.93% 2.14% 16.87 82.63 1994 4.50% 1.95% 16.14 90.24 1995 4.49% 1.92% 15.84 87.15 1996 5.18% 2.11% 15.15 83.29 1997 5.11% 2.07% 16.09 78.35 1998 4.73% 2.38% 14.95 77.85 1772 5.16% 2.42% 11.94 74.27 2000 4.67% 2.17% 24.93 80.31 2001 -0.08% 2.13% 16.14 70.06 2002 0.33% 2.16% 17 24 77.09 2003 5.23% 2.78% 17.18 83.96 2004 5.99% 2.99% 24.51 16B.58 2005 6.68% 3.28% 21.08 126.93 2006 8.06% 3.041% 16.30 71.95 2007 7.23% 3.14% 14.97 67.59 2008 2.46% 1.78% 19.B4 75.02 2009 5.43% 2.86% 17.85 67.80 2010 7.32% 3.15% 16.63 62.43 2011 6.77% 2.81% 17.23 58.20 2012 6.21% 2.76% 17.71 57.86 2013 7.47% 3.01% 18.44 64.52 2014 6.35% 2.56% 19.80 58.98 2015 1.96% 2.375 18.72 62.20 2016 5.98% 2.81% 17.66 59.54 2017 7.13% 2365 18.33 63.60 2018 7.51% 2.61% 19.26 70.48 Data source: WRDS; Data Management: Stata Key Procedure:a. Fama French 48-industry categorization was used to define industry. b. Basic EPS was used in NPM calculation. Note: NPM-Net Profit margin: "ATO - Asset turnover
Step by Step Solution
There are 3 Steps involved in it

Get step-by-step solutions from verified subject matter experts